National Grid 2015 Annual Report Download - page 145
Download and view the complete annual report
Please find page 145 of the 2015 National Grid annual report below. You can navigate through the pages in the report by either clicking on the pages listed below, or by using the keyword search tool below to find specific information within the annual report.-
 1
1 -
2
-
3
-
4
-
5
-
6
-
7
-
8
-
9
-
10
-
11
-
12
-
13
-
14
-
15
-
16
-
17
-
18
-
19
-
20
-
21
-
22
-
23
-
24
-
25
-
26
-
27
-
28
-
29
-
30
-
31
-
32
-
33
-
34
-
35
-
36
-
37
-
38
-
39
-
40
-
41
-
42
-
43
-
44
-
45
-
46
-
47
-
48
-
49
-
50
-
51
-
52
-
53
-
54
-
55
-
56
-
57
-
58
-
59
-
60
-
61
-
62
-
63
-
64
-
65
-
66
-
67
-
68
-
69
-
70
-
71
-
72
-
73
-
74
-
75
-
76
-
77
-
78
-
79
-
80
-
81
-
82
-
83
-
84
-
85
-
86
-
87
-
88
-
89
-
90
-
91
-
92
-
93
-
94
-
95
-
96
-
97
-
98
-
99
-
100
-
101
-
102
-
103
-
104
-
105
-
106
-
107
-
108
-
109
-
110
-
111
-
112
-
113
-
114
-
115
-
116
-
117
-
118
-
119
-
120
-
121
-
122
-
123
-
124
-
125
-
126
-
127
-
128
-
129
-
130
-
131
-
132
-
133
-
134
-
 135
135 -
 136
136 -
 137
137 -
 138
138 -
 139
139 -
 140
140 -
 141
141 -
 142
142 -
 143
143 -
 144
144 -
 145
145 -
 146
146 -
 147
147 -
 148
148 -
 149
149 -
 150
150 -
 151
151 -
 152
152 -
 153
153 -
 154
154 -
 155
155 -
156
-
157
-
158
-
159
-
160
-
161
-
162
-
163
-
164
-
165
-
166
-
167
-
168
-
169
-
170
-
171
-
172
-
173
-
174
-
175
-
176
-
177
-
178
-
179
-
180
-
181
-
182
-
183
-
184
-
185
-
186
-
187
-
188
-
189
-
190
-
191
-
192
-
193
-
194
-
195
-
196
-
197
-
198
-
199
-
200
 |
 |

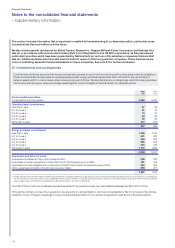
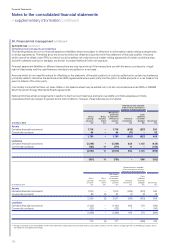
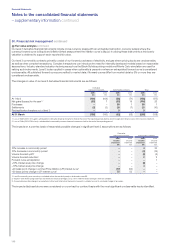
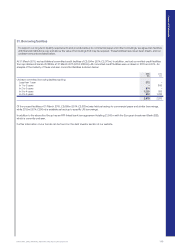
30. Financial risk management continued
(b) Liquidity risk
Our policy is to determine our liquidity requirements by the use of both short-term and long-term cash flow forecasts. These forecasts are
supplemented by a financial headroom analysis which is used to assess funding requirements for at least a 24 month period and maintain
adequate liquidity for a continuous 12 month period.
We believe our contractual obligations, including those shown in commitments and contingencies in note 27 can be met from existing
cash and investments, operating cash flows and other financings that we reasonably expect to be able to secure in the future, together
with the use of committed facilities if required.
Our debt agreements and banking facilities contain covenants, including those relating to the periodic and timely provision of financial
information by the issuing entity and financial covenants such as restrictions on the level of subsidiary indebtedness. Failure to comply
withthese covenants, or to obtain waivers of those requirements, could in some cases trigger a right, at the lender’s discretion, to require
repayment of some of our debt and may restrict our ability to draw upon our facilities or access the capital markets.
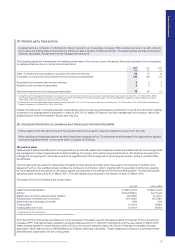
The following is an analysis of the contractual undiscounted cash flows payable under financial liabilities and derivative assets and liabilities
as at the reporting date:
At 31 March 2015
Less
than
1 year
£m
1 to 2
years
£m
2 to 3
years
£m
More
than
3 years
£m
Total
£m
Non-derivative financial liabilities
Borrowings, excluding finance lease liabilities (2,289) (1,179) (1,513) (20,235) (25,216)
Interest payments on borrowings1(790) (790) (766) (13,587) (15,933)
Finance lease liabilities (44) (41) (32) (86) (203)
Other non-interest bearing liabilities (2,744) (216) – – (2,960)
Derivative financial liabilities
Derivative contracts – receipts 602 244 411 1,194 2,451
Derivative contracts – payments (935) (318) (952) (1,631) (3,836)
Commodity contracts (116) (43) (21) –(180)
(6,316) (2,343) (2,873) (34,345) (45,877)
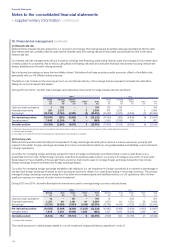
At 31 March 2014
Less
than
1 year
£m
1 to 2
years
£m
2 to 3
years
£m
More
than
3 years
£m
Total
£m
Non-derivative financial liabilities
Borrowings, excluding finance lease liabilities (3,091) (864) (1,140) (20,275) (25,370)
Interest payments on borrowings1(826) (812) (796) (14,571) ( 17, 0 0 5 )
Finance lease liabilities (18) (19) (20) (112) (169)
Other non-interest bearing liabilities (2,584) (190) – – (2,774)
Derivative financial liabilities
Derivative contracts – receipts 1,068 950 153 1,155 3,326
Derivative contracts – payments (556) (861) (144) (1,638) (3,199)
Commodity contracts (177) (30) (22) 2(227)
(6,18 4) (1,826) (1,969) (35,439) (45,418)
1. The interest on borrowings is calculated based on borrowings held at 31 March without taking account of future issues. Floating rate interest is estimated using a forward interest rate curve
as at 31 March. Payments are included on the basis of the earliest date on which the Company can be required to settle.
Financial Statements
NATIONAL GRID ANNUAL REPORT AND ACCOUNTS 2014/15 143