National Grid 2015 Annual Report Download - page 76
Download and view the complete annual report
Please find page 76 of the 2015 National Grid annual report below. You can navigate through the pages in the report by either clicking on the pages listed below, or by using the keyword search tool below to find specific information within the annual report.-
 1
1 -
2
-
3
-
4
-
5
-
6
-
7
-
8
-
9
-
10
-
11
-
12
-
13
-
14
-
15
-
16
-
17
-
18
-
19
-
20
-
21
-
22
-
23
-
24
-
25
-
26
-
27
-
28
-
29
-
30
-
31
-
32
-
33
-
34
-
35
-
36
-
37
-
38
-
39
-
40
-
41
-
42
-
43
-
44
-
45
-
46
-
47
-
48
-
49
-
50
-
51
-
52
-
53
-
54
-
55
-
56
-
57
-
58
-
59
-
60
-
61
-
62
-
63
-
64
-
65
-
 66
66 -
 67
67 -
 68
68 -
 69
69 -
 70
70 -
 71
71 -
 72
72 -
 73
73 -
 74
74 -
 75
75 -
 76
76 -
 77
77 -
 78
78 -
 79
79 -
 80
80 -
 81
81 -
 82
82 -
 83
83 -
 84
84 -
 85
85 -
 86
86 -
87
-
88
-
89
-
90
-
91
-
92
-
93
-
94
-
95
-
96
-
97
-
98
-
99
-
100
-
101
-
102
-
103
-
104
-
105
-
106
-
107
-
108
-
109
-
110
-
111
-
112
-
113
-
114
-
115
-
116
-
117
-
118
-
119
-
120
-
121
-
122
-
123
-
124
-
125
-
126
-
127
-
128
-
129
-
130
-
131
-
132
-
133
-
134
-
135
-
136
-
137
-
138
-
139
-
140
-
141
-
142
-
143
-
144
-
145
-
146
-
147
-
148
-
149
-
150
-
151
-
152
-
153
-
154
-
155
-
156
-
157
-
158
-
159
-
160
-
161
-
162
-
163
-
164
-
165
-
166
-
167
-
168
-
169
-
170
-
171
-
172
-
173
-
174
-
175
-
176
-
177
-
178
-
179
-
180
-
181
-
182
-
183
-
184
-
185
-
186
-
187
-
188
-
189
-
190
-
191
-
192
-
193
-
194
-
195
-
196
-
197
-
198
-
199
-
200
 |
 |

Corporate Governance
Directors’ Remuneration Report continued
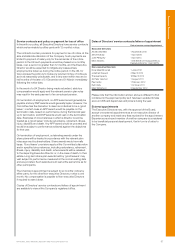
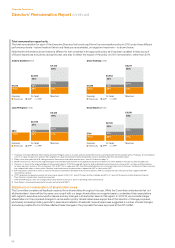
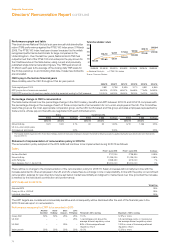
Performance graph and table
This chart shows National Grid plc’s six year annual total shareholder
return (TSR) performance against the FTSE 100 Index since 31 March
2009. The FTSE 100 Index has been chosen because it is the widely
recognised performance benchmark for large companies in the
United Kingdom. Over the last four years, National Grid’s TSR has
outperformed that of the FTSE 100 and underpins the pay shown for
the Chief Executive in the table below, using current and previously
published single total remuneration figures. The TSR level shown at
31March each year isthe average of the closing daily TSR levels for
the 30 day period upto and including that date. It assumes dividends
are reinvested.
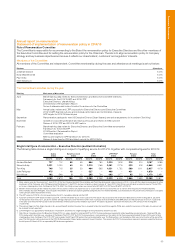
CEO’s pay in the last six financial years
Steve Holliday was the CEO throughout this six year period.
2009/10 2010/11 2011/12 2012/13 2013/14 2014/15
Total single figure £’000 3,931 3,738 3,539 3,170 4,801 4,845
APP (proportion of maximum awarded) 95.33% 81.33% 68.67% 56.65% 77.9 4% 94.80%
PSP/LTPP (proportion of maximum vesting including expected vesting for RoE measure) 100.00% 65.15% 49.50% 25.15% 76.20% 55.81%
Percentage change in CEO’s remuneration
The table below shows how the percentage change in the CEO’s salary, benefits and APP between 2013/14 and 2014/15 compares with
the percentage change in the average of each of those components of remuneration for non-union employees in the UK. The Committee
views this group as the most appropriate comparator group, as the CEO is UK-based and this group excludes employees represented by
trade unions, whose pay and benefits are negotiated with each individual union.
Salary Taxable benefits APP
£’000 £’000 Increase £’000 £’000 Increase £’000 £’000 Increase
2014/15 2013/14 2014/15 2013/14 2014/15 2013/14
Steve Holliday 1,021 1,000 2.1% 40 35 14.3% 1,210 1,169 3.5%
UK non-union employees
(increase per employee) 2.3% 10.6% 3.5%
1. The Taxable benefits figure for 2014/15 for Steve Holliday and for UK non-union employees includes the benefit of Sharesave options granted during the year which were not in the benefits
total for 2013/14.
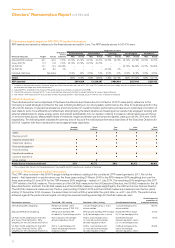
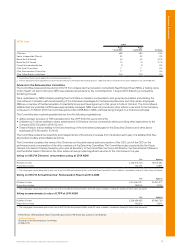
Statement of implementation of remuneration policy in 2015/16
The remuneration policy adopted at the 2014 AGM will continue to be implemented during 2015/16 as follows:
Salary
From 1 June 2015 From 1 June 2014 Increase
Andrew Bonfield £737,000 £729,800 0.99%
Steve Holliday £1,035,000 £1,025,000 0.98%
John Pettigrew £508,250 £475,000 7%
Dean Seavers (from 1 April 2015) $1,000,000 $1,000,000 0%
There will be no change to the implementation of the remuneration policy for 2015/16. Salary increases will normally be in line with the
increase awarded to other employees in the UK and US, unless there is a change in role or responsibility. In line with the policy on recruitment
remuneration, salaries for new directors may be set below market level initially and aligned to market level over time (provided the increase
ismerited by the individual’s contribution and performance).
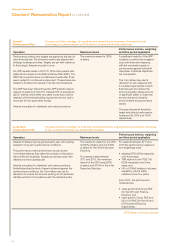
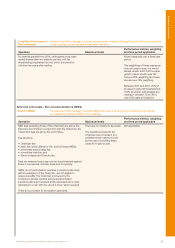
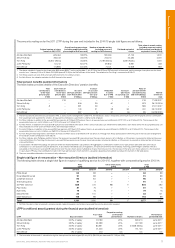
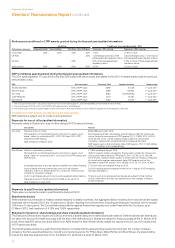
APP measures for 2015/16
Weighting
Adjusted EPS 35%
Group or UK or US RoE 35%
Individual objectives 30%
The APP targets are considered commercially sensitive and consequently will be disclosed after the end of the financial year in the
2015/16 annual report on remuneration.
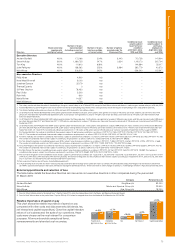
Performance measures for LTPP to be awarded in 2015
Andrew
Bonfield
Steve
Holliday
Dean
Seavers
John
Pettigrew Threshold – 20% vesting Maximum – 100% vesting
Group RoE 50% 50% 25% 25% 11.0% 12.5% or more
UK RoE – – – 25% 1 percentage point above the
average allowed regulatory return
3.5 percentage points or more above
the average allowed regulatory return
US RoE – – 25% –90% of the average allowed
regulatory return
105% or more of the average allowed
regulatory return
Value growth 50% 50% 50% 50% 10.0% 12.0% or more
0
100
50
300
250
200
150 155.42
173.94
131.11
167.17
123.65
155.79
100.00
190.98
197.9 4
248.64
227. 33
223.74
211.45
31/03/1031/03/09 31/03/11 31/03/12 31/03/1431/03/13 31/03/15
National Grid plc FTSE 100 Index
Source: Thomson Reuters
Total shareholder return
74