National Grid 2015 Annual Report Download - page 18
Download and view the complete annual report
Please find page 18 of the 2015 National Grid annual report below. You can navigate through the pages in the report by either clicking on the pages listed below, or by using the keyword search tool below to find specific information within the annual report.-
 1
1 -
2
-
3
-
4
-
5
-
6
-
7
-
 8
8 -
 9
9 -
 10
10 -
 11
11 -
 12
12 -
 13
13 -
 14
14 -
 15
15 -
 16
16 -
 17
17 -
 18
18 -
 19
19 -
 20
20 -
 21
21 -
 22
22 -
 23
23 -
 24
24 -
 25
25 -
 26
26 -
 27
27 -
 28
28 -
29
-
30
-
31
-
32
-
33
-
34
-
35
-
36
-
37
-
38
-
39
-
40
-
41
-
42
-
43
-
44
-
45
-
46
-
47
-
48
-
49
-
50
-
51
-
52
-
53
-
54
-
55
-
56
-
57
-
58
-
59
-
60
-
61
-
62
-
63
-
64
-
65
-
66
-
67
-
68
-
69
-
70
-
71
-
72
-
73
-
74
-
75
-
76
-
77
-
78
-
79
-
80
-
81
-
82
-
83
-
84
-
85
-
86
-
87
-
88
-
89
-
90
-
91
-
92
-
93
-
94
-
95
-
96
-
97
-
98
-
99
-
100
-
101
-
102
-
103
-
104
-
105
-
106
-
107
-
108
-
109
-
110
-
111
-
112
-
113
-
114
-
115
-
116
-
117
-
118
-
119
-
120
-
121
-
122
-
123
-
124
-
125
-
126
-
127
-
128
-
129
-
130
-
131
-
132
-
133
-
134
-
135
-
136
-
137
-
138
-
139
-
140
-
141
-
142
-
143
-
144
-
145
-
146
-
147
-
148
-
149
-
150
-
151
-
152
-
153
-
154
-
155
-
156
-
157
-
158
-
159
-
160
-
161
-
162
-
163
-
164
-
165
-
166
-
167
-
168
-
169
-
170
-
171
-
172
-
173
-
174
-
175
-
176
-
177
-
178
-
179
-
180
-
181
-
182
-
183
-
184
-
185
-
186
-
187
-
188
-
189
-
190
-
191
-
192
-
193
-
194
-
195
-
196
-
197
-
198
-
199
-
200
 |
 |
Strategic Report
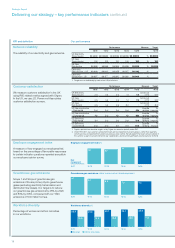
KPI and denition Our performance
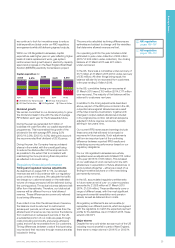
Adjusted EPS
Adjusted earnings represent profit for the
yearattributable to equity shareholders. This
excludes exceptional items, remeasurements
and stranded cost recoveries (see pages
103and104).
Adjusted earnings per share provides a
measure of shareholder return that is
comparable over time.
44.9 45.5 50.9 53.5 58 .1
Adjusted EPS
pence1
11/12
1
0/11 12/13 13/14 14/15
1. Comparative amounts have been restated to reflect the impact of additional shares issued as scrip dividends.
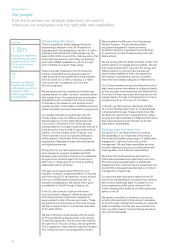
Group return on equity (RoE)
We measure our performance in generating
value for our shareholders by dividing our
annual return by our equity base.
This calculation provides a measure of the
performance of the whole Group compared
with the amounts invested by the Group in
assets attributable to equity shareholders.
11/12
1
0/11 12/13 13/14 14/15
11.8
10.8 10.8 10.9 11.3 11.2 11.7 11.4 11.4 11.8
Group return on equity
%
Including major storms Excluding major storms
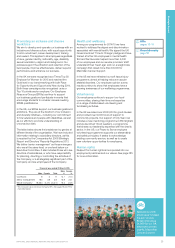
Regulated asset growth
Maintaining efficient growth in our regulated
assets ensures we are well positioned to
provide consistently high levels of service to
ourcustomers and increases our revenue
allowances in future years.
11/12
10/11
12/13 13/14 14/15
29.91
5%
8% 7%
4% 3%
31.2 33.7 34.7 37.02
Total regulated assets and regulated asset growth
£bn
Regulated asset growth
1. US base rate calculated as at 31 December 2010 in this year.
2. Estimated figure until the conclusion of the regulatory reporting cycle.
Value added
Reflects value to shareholders of dividend
andgrowth in National Grid’s assets, net of
thegrowth in overall debt.
13/14 14/15
2.1
1.7
Value added
£bn
Value added per share (pence)
44.7
57. 2
11/12
1
0/11 12/13
Not
measured
Not
measured Not
measured
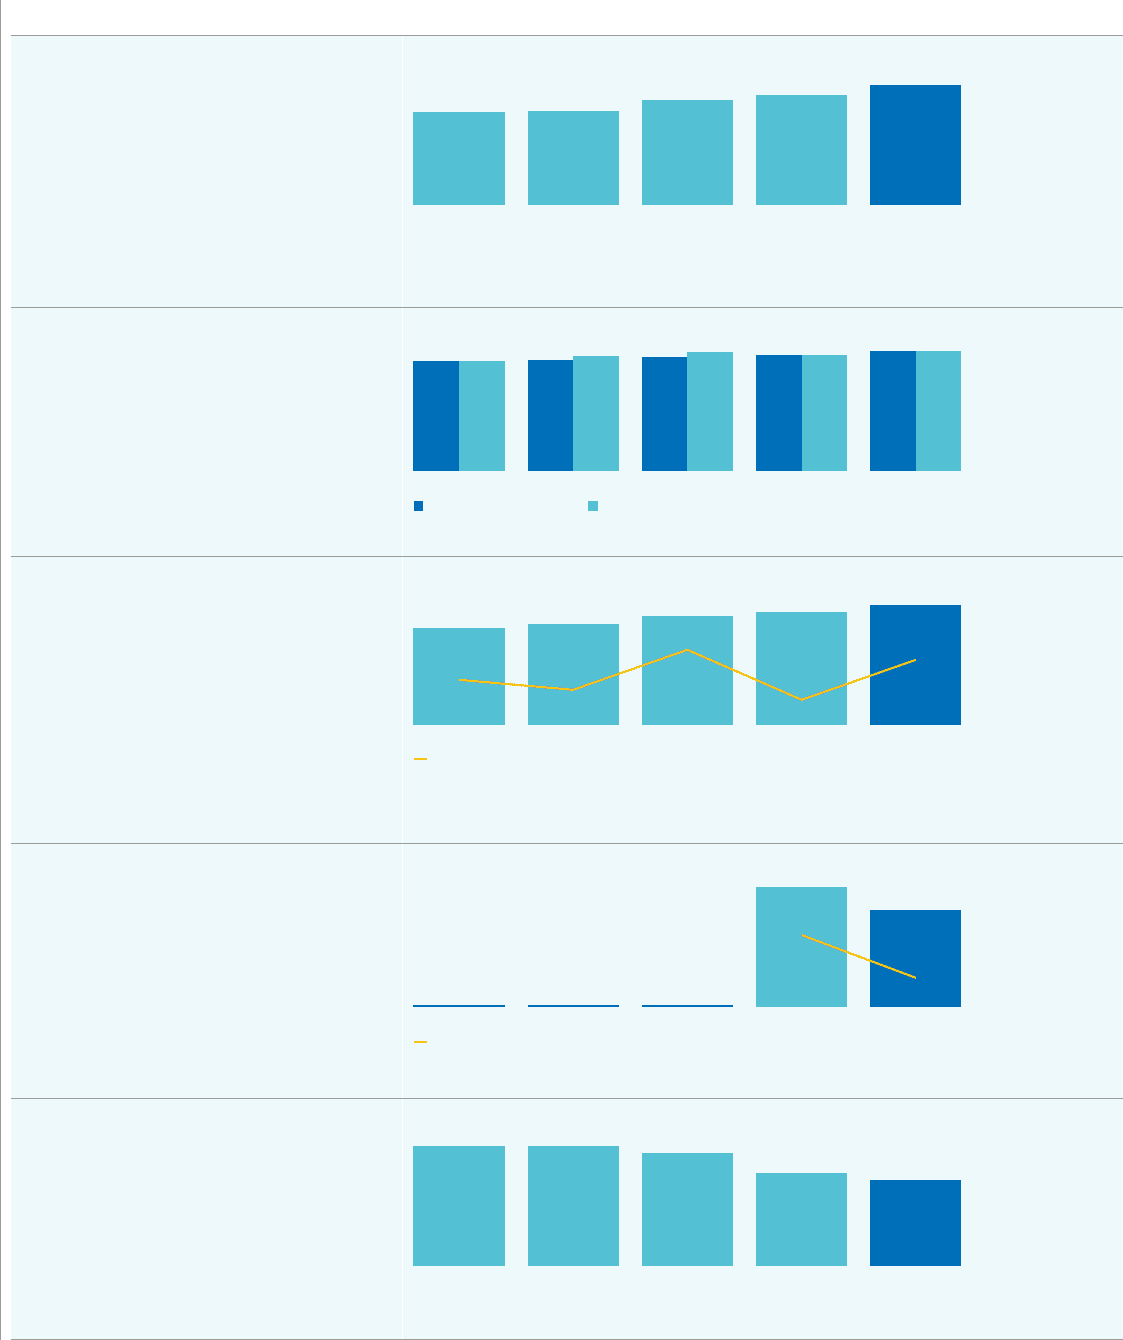
Employee lost time injury
frequency rate
Number of employee lost time injuries per
100,000hours worked in a 12 month period.
Our ambition is to achieve a world-class safety
performance of below 0.1.
11/12
1
0/11 12/13 13/14 14/15
0.18 0.18 0.17
0.14 0.13
Employee lost time injury frequency rate
per 100,000 hours worked
The Board uses a range of financial and non-financial metrics,
reportedperiodically, against which we measure Group performance.
Delivering our strategy – key performance indicators
16