National Grid 2015 Annual Report Download - page 129
Download and view the complete annual report
Please find page 129 of the 2015 National Grid annual report below. You can navigate through the pages in the report by either clicking on the pages listed below, or by using the keyword search tool below to find specific information within the annual report.-
 1
1 -
2
-
3
-
4
-
5
-
6
-
7
-
8
-
9
-
10
-
11
-
12
-
13
-
14
-
15
-
16
-
17
-
18
-
19
-
20
-
21
-
22
-
23
-
24
-
25
-
26
-
27
-
28
-
29
-
30
-
31
-
32
-
33
-
34
-
35
-
36
-
37
-
38
-
39
-
40
-
41
-
42
-
43
-
44
-
45
-
46
-
47
-
48
-
49
-
50
-
51
-
52
-
53
-
54
-
55
-
56
-
57
-
58
-
59
-
60
-
61
-
62
-
63
-
64
-
65
-
66
-
67
-
68
-
69
-
70
-
71
-
72
-
73
-
74
-
75
-
76
-
77
-
78
-
79
-
80
-
81
-
82
-
83
-
84
-
85
-
86
-
87
-
88
-
89
-
90
-
91
-
92
-
93
-
94
-
95
-
96
-
97
-
98
-
99
-
100
-
101
-
102
-
103
-
104
-
105
-
106
-
107
-
108
-
109
-
110
-
111
-
112
-
113
-
114
-
115
-
116
-
117
-
118
-
 119
119 -
 120
120 -
 121
121 -
 122
122 -
 123
123 -
 124
124 -
 125
125 -
 126
126 -
 127
127 -
 128
128 -
 129
129 -
 130
130 -
 131
131 -
 132
132 -
 133
133 -
 134
134 -
 135
135 -
 136
136 -
 137
137 -
 138
138 -
 139
139 -
140
-
141
-
142
-
143
-
144
-
145
-
146
-
147
-
148
-
149
-
150
-
151
-
152
-
153
-
154
-
155
-
156
-
157
-
158
-
159
-
160
-
161
-
162
-
163
-
164
-
165
-
166
-
167
-
168
-
169
-
170
-
171
-
172
-
173
-
174
-
175
-
176
-
177
-
178
-
179
-
180
-
181
-
182
-
183
-
184
-
185
-
186
-
187
-
188
-
189
-
190
-
191
-
192
-
193
-
194
-
195
-
196
-
197
-
198
-
199
-
200
 |
 |

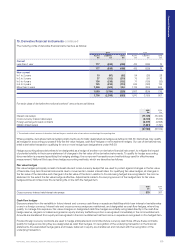
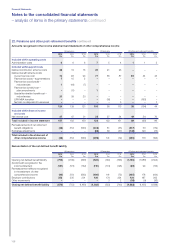
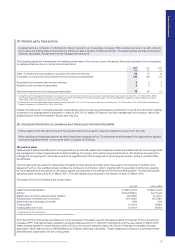
22. Pensions and other post-retirement benefits continued
The Group’s obligation in respect of DB pension plans is calculated separately for each plan by projecting the estimated amount of future
benefit payments that employees have earned for their pensionable service in the current and prior periods. These future benefit payments
are discounted to determine the present value of the liabilities and the fair value of plan assets and any unrecognised past service cost is
then deducted. The discount rate used is the yield at the valuation date on high-quality corporate bonds.
The Group takes advice from independent actuaries relating to the appropriateness of any key assumptions applied which include life
expectancy of members, expected salary and pension increases, and inflation. It should be noted that comparatively small changes in
theassumptions used may have a significant effect on the amounts recognised in the income statement and the statement of other
comprehensive income and the net liability recognised in the statement of financial position.
Remeasurements of net retirement obligations are recognised in full in the period in which they occur in the statement of other
comprehensive income.
Risks
The DB pension obligations and other post-retirement benefit liabilities are exposed to the primary risks outlined below.
Liabilities are calculated using discount rates set with reference to yields on high-quality corporate bonds prevailing in the US and UK
debtmarkets and will fluctuate as yields change. Plan funds are invested in a variety of asset classes, principally: equities, government
securities, corporate bonds and property. Consequently, actual returns will differ from the underlying discount rate adopted and therefore
have an impact on the net balance sheet liability.
Changes in inflation will affect both current and future pension payments and are partially mitigated through investment in inflation
matching assets and hedging instruments.
Longevity is also a key driver of liabilities and changes in expected mortality will have a direct impact on liabilities. The liabilities are,
inaggregate, relatively mature which serves to mitigate this risk to some extent.
Each plan’s investment strategy seeks to balance the level of investment return sought with the aim of reducing volatility and risk.
Inundertaking this approach reference is made both to the maturity of the liabilities and the funding level of that plan. A number
offurtherstrategies are employed to manage underlying risks, including liability matching asset strategies, diversification of asset
portfolios,interest rate hedging and active management of foreign exchange exposure.
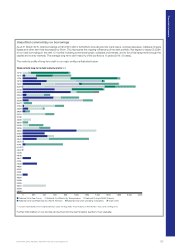
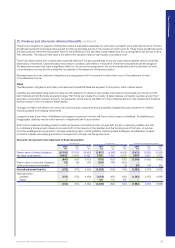
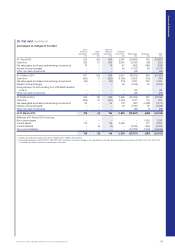
Amounts recognised in the statement of financial position
UK pensions US pensions US other post-retirement benefits
2015
£m
2014
£m
2013
£m
2015
£m
2014
£m
2013
£m
2015
£m
2014
£m
2013
£m
Present value of funded obligations (20,053) (18,10 0) (18,495) (5,827) (4,566) (4,915) (3,412) (2,680) (3,020)
Fair value of plan assets 19,453 17, 4 0 9 17, 3 9 2 5,052 4,229 4,378 1,903 1,620 1,515
(600) (691) (1,103) (775) (337) (537) (1,509) (1,060) (1,505)
Present value of unfunded obligations (72) (62) (66) (228) (186) (200) –– –
Other post-employment liabilities –– – ––(3) (74) (75) (83)
Net defined benefit liability (672) (753) (1,16 9) (1,003) (523) (740) (1,583) (1,135) (1,588)
Represented by:
Liabilities (672) (753) (1,16 9 ) (1,124) (697) (935) (1,583) (1,135) (1,588)
Assets –– – 121 174 195 –– –
(672) (753) (1,169) (1,003) (523) (740 ) (1,583) (1,135) (1,588)
Financial Statements
NATIONAL GRID ANNUAL REPORT AND ACCOUNTS 2014/15 127