National Grid 2015 Annual Report Download - page 103
Download and view the complete annual report
Please find page 103 of the 2015 National Grid annual report below. You can navigate through the pages in the report by either clicking on the pages listed below, or by using the keyword search tool below to find specific information within the annual report.-
 1
1 -
2
-
3
-
4
-
5
-
6
-
7
-
8
-
9
-
10
-
11
-
12
-
13
-
14
-
15
-
16
-
17
-
18
-
19
-
20
-
21
-
22
-
23
-
24
-
25
-
26
-
27
-
28
-
29
-
30
-
31
-
32
-
33
-
34
-
35
-
36
-
37
-
38
-
39
-
40
-
41
-
42
-
43
-
44
-
45
-
46
-
47
-
48
-
49
-
50
-
51
-
52
-
53
-
54
-
55
-
56
-
57
-
58
-
59
-
60
-
61
-
62
-
63
-
64
-
65
-
66
-
67
-
68
-
69
-
70
-
71
-
72
-
73
-
74
-
75
-
76
-
77
-
78
-
79
-
80
-
81
-
82
-
83
-
84
-
85
-
86
-
87
-
88
-
89
-
90
-
91
-
92
-
 93
93 -
 94
94 -
 95
95 -
 96
96 -
 97
97 -
 98
98 -
 99
99 -
 100
100 -
 101
101 -
 102
102 -
 103
103 -
 104
104 -
 105
105 -
 106
106 -
 107
107 -
 108
108 -
 109
109 -
 110
110 -
 111
111 -
 112
112 -
 113
113 -
114
-
115
-
116
-
117
-
118
-
119
-
120
-
121
-
122
-
123
-
124
-
125
-
126
-
127
-
128
-
129
-
130
-
131
-
132
-
133
-
134
-
135
-
136
-
137
-
138
-
139
-
140
-
141
-
142
-
143
-
144
-
145
-
146
-
147
-
148
-
149
-
150
-
151
-
152
-
153
-
154
-
155
-
156
-
157
-
158
-
159
-
160
-
161
-
162
-
163
-
164
-
165
-
166
-
167
-
168
-
169
-
170
-
171
-
172
-
173
-
174
-
175
-
176
-
177
-
178
-
179
-
180
-
181
-
182
-
183
-
184
-
185
-
186
-
187
-
188
-
189
-
190
-
191
-
192
-
193
-
194
-
195
-
196
-
197
-
198
-
199
-
200
 |
 |

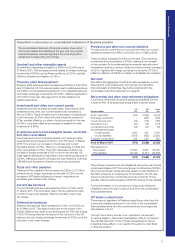
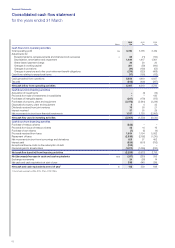
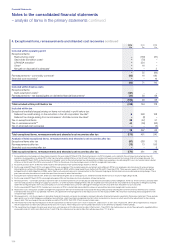
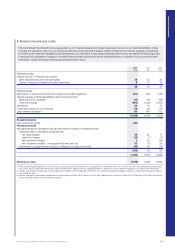
3. Operating costs
Below we have presented separately certain items included in our operating costs. These include a breakdown of payroll costs
(including disclosure of amounts paid to key management personnel) and fees paid to our auditors.
Rentals under operating leases are charged to the income statement on a straight-line basis over the term of the relevant lease.
Before exceptional items,
remeasurements and stranded
cost recoveries
Exceptional items,
remeasurements and stranded
cost recoveries Total
2015
£m
2014
£m
2013
£m
2015
£m
20141
£m
20131
£m
2015
£m
20141
£m
20131
£m
Depreciation and amortisation 1,482 1,416 1,361 –– – 1,482 1,416 1,361
Payroll costs 1,459 1,373 1,434 –(155) 26 1,459 1,218 1,460
Purchases of electricity 1,615 1,513 1,251 70 (49) (111) 1,685 1,464 1,140
Purchases of gas 1,403 1,722 1,384 13 33 (69) 1,416 1,755 1,315
Rates and property taxes 1,004 963 969 –– – 1,004 963 969
Balancing Services Incentive
Scheme 874 872 805 –– – 874 872 805
Payments to other UK network
owners 801 630 487 –– – 801 630 487
Other 2,700 2,656 3,029 –100 44 2,700 2,756 3,073
11,338 11,145 10,720 83 (71) (110) 11,421 11,074 10,610
Operating costs include:
Inventory consumed 365 422 389
Operating leases 98 115 109
Research and development expenditure 23 12 15
1. Comparatives have been represented on a basis consistent with the current year presentation.
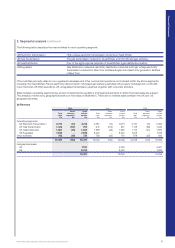
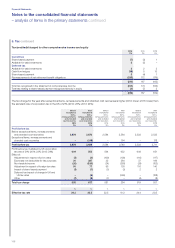
(a) Payroll costs
2015
£m
20141
£m
20131
£m
Wages and salaries21,598 1,377 1,597
Social security costs 129 126 120
Other pension costs (note 22) 224 229 234
Share-based payment 20 20 20
Severance costs (excluding pension costs) 430 16
1,975 1,782 1,987
Less: payroll costs capitalised (516) (564) (527)
1,459 1,218 1,460
1. Comparatives have been represented on a basis consistent with the current year presentation.
2. Included within wages and salaries are US other post-retirement benefit costs of £39m (2014: £44m; 2013: £43m); a curtailment gain on LIPA MSA transaction of £nil (2014: £198m; 2013:
£nil) and a curtailment loss following disposal of businesses of £nil (2014: £nil; 2013: £1m). For further information refer to note 22.
(b) Number of employees
31 March
2015
Monthly
average
2015
31 March
2014
Monthly
average
2014
31 March
2013
Monthly
average
2013
UK 9,701 9,670 9,693 9,641 9,990 9,816
US 14,573 14,434 14,216 15,094 15,438 15,555
24,274 24,104 23,909 24,735 25,428 25,371
The vast majority of employees in the US are either directly or indirectly employed in the transmission, distribution and generation of
electricity or the distribution of gas, while those in the UK are either directly or indirectly employed in the transmission and distribution
ofgas or the transmission of electricity. At 31 March 2015, there were 2,131 (2014: 2,044; 2013: 2,151) employees in other operations,
excluding shared services.
Financial Statements
NATIONAL GRID ANNUAL REPORT AND ACCOUNTS 2014/15 101