Mazda 2014 Annual Report Download - page 63
Download and view the complete annual report
Please find page 63 of the 2014 Mazda annual report below. You can navigate through the pages in the report by either clicking on the pages listed below, or by using the keyword search tool below to find specific information within the annual report.-
 1
1 -
2
-
3
-
4
-
5
-
6
-
7
-
8
-
9
-
10
-
11
-
12
-
13
-
14
-
15
-
16
-
17
-
18
-
19
-
20
-
21
-
22
-
23
-
24
-
25
-
26
-
27
-
28
-
29
-
30
-
31
-
32
-
33
-
34
-
35
-
36
-
37
-
38
-
39
-
40
-
41
-
42
-
43
-
44
-
45
-
46
-
47
-
48
-
49
-
50
-
51
-
52
-
 53
53 -
 54
54 -
 55
55 -
 56
56 -
 57
57 -
 58
58 -
 59
59 -
 60
60 -
 61
61 -
 62
62 -
 63
63 -
 64
64 -
 65
65 -
 66
66 -
 67
67
 |
 |
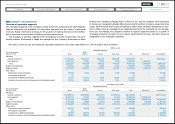
Millions of yen
Reportable segments
Adjustment (*1) Consolidated (*2)
For the year ended
March 31, 2013 Japan
North
America Europe Other areas Total
Net sales:
Outside customers ¥ 795,919 ¥647,382 ¥344,434 ¥417,535 ¥2,205,270 ¥ — ¥2,205,270
Inter-segment 1,097,663 2,598 10,348 1,123 1,111,732 (1,111,732) —
Total 1,893,582 649,980 354,782 418,658 3,317,002 (1,111,732) 2,205,270
Segment income/(loss) 108,389 (48,877) 3,122 16,839 79,473 (25,537) 53,936
Segment assets 1,775,831 309,211 162,047 176,543 2,423,632 (445,065) 1,978,567
Other items:
Depreciation and amortization 55,899 847 2,220 748 59,714 — 59,714
Amortization of goodwill 14 226 — — 240 — 240
In vestments in affiliated companies 15,573 35,635 2,280 55,558 109,046 — 109,046
In crease in property, plant and equipment and intangible assets 56,043 19,520 633 994 77,190 — 77,190
(*1) Notes on adjustment:
(1) The adjustment on segment income/(loss) are eliminations of inter-segment transactions.
(2) The adjustment on segment assets are mainly eliminations of inter-segment receivables and payables.
(*2) Segment income/(loss) is reconciled with the operating income/(loss) in the consolidated statements of income for the years ended March 31, 2014 and 2013.
Segment assets are reconciled with the total assets in the consolidated balance sheets for the years ended March 31, 2014 and 2013.
Information by geographic areas
The sales information by geographic areas as of March 31, 2014 and 2013 were as follows:
Millions of yen
Thousands of
U.S. dollars
For the years ended March 31 2014 2013 2014
Japan ¥ 655,716 ¥ 588,042 $ 6,366,175
North America 834,803 651,165 8,104,883
Europe 534,937 347,918 5,193,563
Other areas 666,782 618,145 6,473,612
Total ¥2,692,238 ¥2,205,270 $26,138,233
Sales is categorized into the countries or regions based on the customers’ locations.
61
Mazda Annual Report 2014
CONTENTS
Foundations Underpinning
Sustainable Growth
Financial Section
Review of Operations
Message from Management
Introduction
Brand Value Management