Mazda 2014 Annual Report Download - page 39
Download and view the complete annual report
Please find page 39 of the 2014 Mazda annual report below. You can navigate through the pages in the report by either clicking on the pages listed below, or by using the keyword search tool below to find specific information within the annual report.-
 1
1 -
2
-
3
-
4
-
5
-
6
-
7
-
8
-
9
-
10
-
11
-
12
-
13
-
14
-
15
-
16
-
17
-
18
-
19
-
20
-
21
-
22
-
23
-
24
-
25
-
26
-
27
-
28
-
 29
29 -
 30
30 -
 31
31 -
 32
32 -
 33
33 -
 34
34 -
 35
35 -
 36
36 -
 37
37 -
 38
38 -
 39
39 -
 40
40 -
 41
41 -
 42
42 -
 43
43 -
 44
44 -
 45
45 -
 46
46 -
 47
47 -
 48
48 -
 49
49 -
50
-
51
-
52
-
53
-
54
-
55
-
56
-
57
-
58
-
59
-
60
-
61
-
62
-
63
-
64
-
65
-
66
-
67
 |
 |
Management Review and Analysis
March 2014 Fiscal Year
Review of Operations
(Operating Environment)
The mood in the Mazda Group’s operating
environment in the March 2014 fiscal year
was guardedly hopeful; although the outlook
for the economies of emerging countries was
uncertain, overall the global economy contin-
ued to make a gradual recovery. The U.S.
economy continued its gradual improvement,
and signs of recovery were also seen in the
European economy. The Japanese economy
was on the way to a solid recovery as the
result of fiscal and monetary policies imple-
mented by the government and the Bank of
Japan, and last-minute demand was seen
prior to a recent hike in consumption tax.
Under these circumstances, while steadily
implementing the key initiatives of its
“Structural Reform Plan,” the Mazda Group
pressed forward with the global expansion of
sales of vehicles with its new-generation
technology, SKYACTIV, and strove to improve
its earning structure.
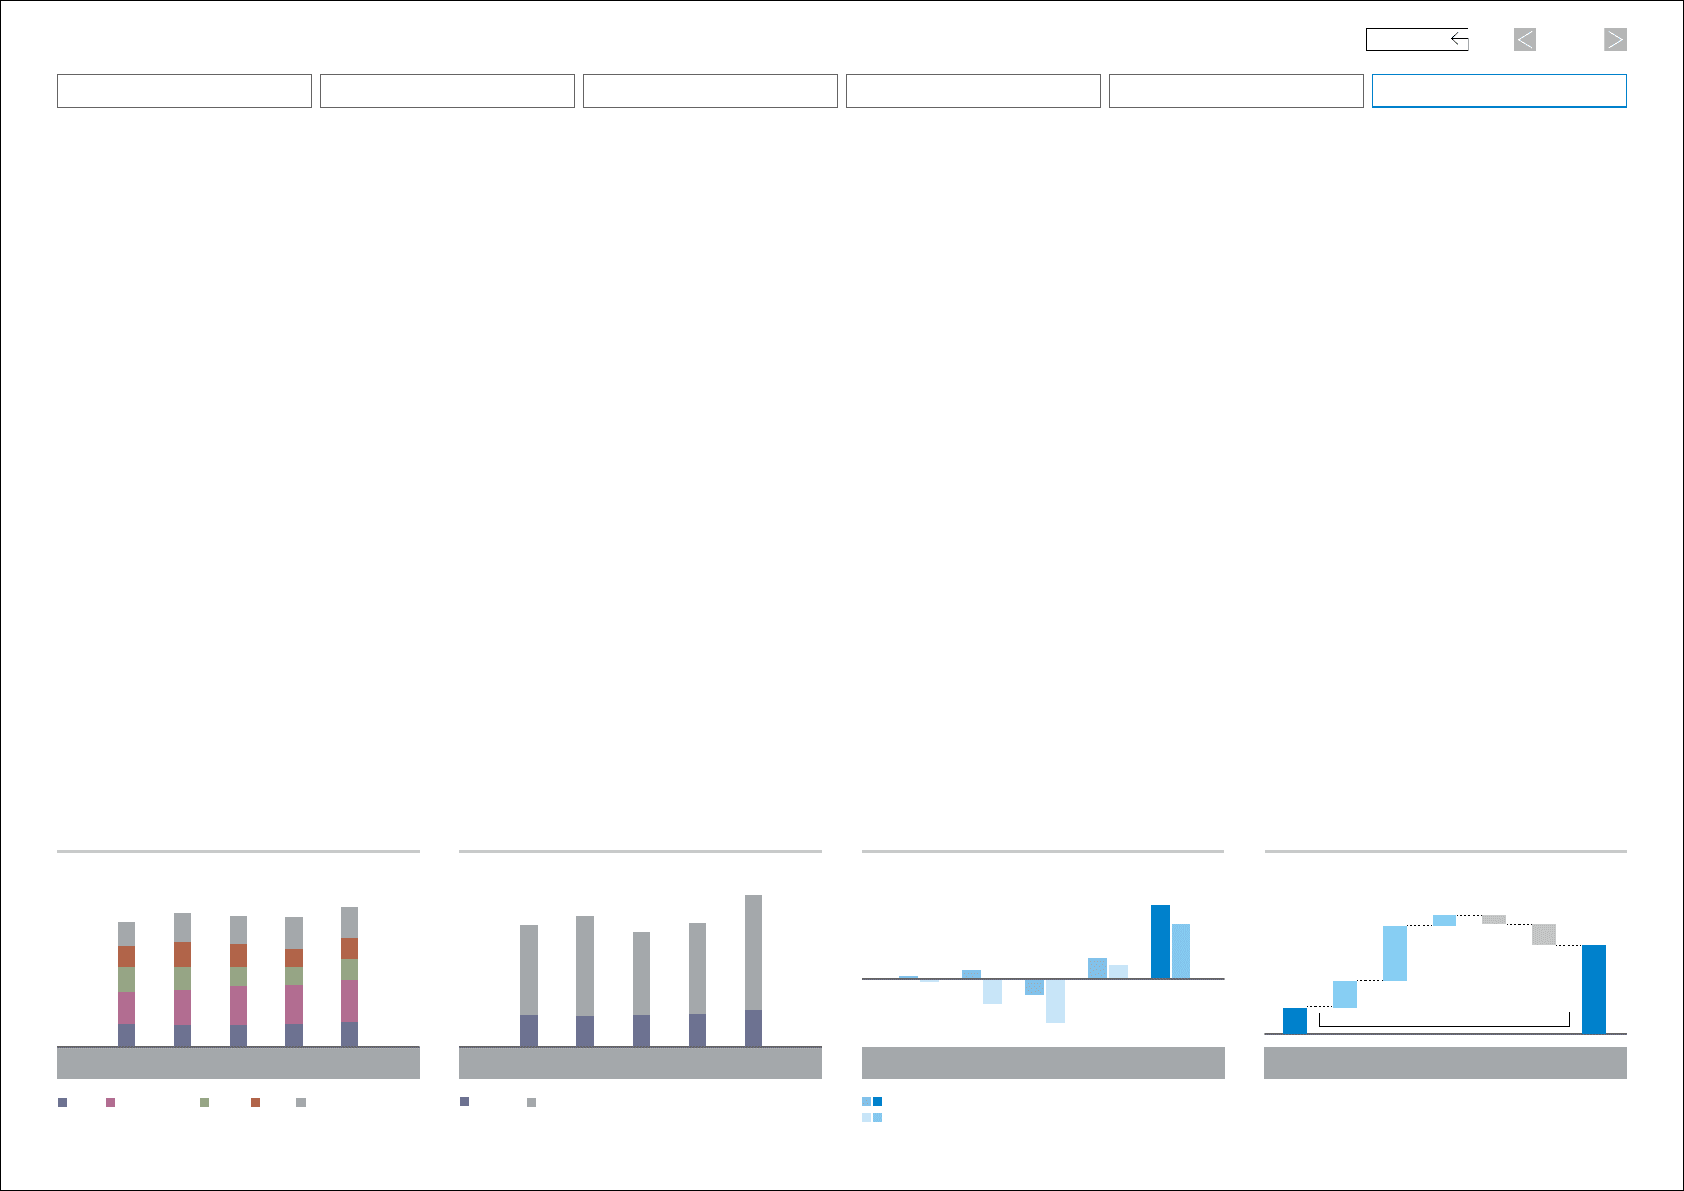
(Global Sales Volume)
In total, global sales volume for the fiscal year
ended March 31, 2014, was 1,331,000 units, up
7.8% year on year. The Mazda CX-5 and the
Mazda6 (Japanese name: Mazda Atenza)
drove global sales, and sales were also strong
of the Mazda3 (Japanese name: Mazda Axela)
newly introduced during the period.
By market, Japan’s domestic sales volume
was 244,000 units, up 12.6% year on year, as
orders for the new Axela far exceeded the tar-
get, and sales of the Atenza and CX-5 remained
strong. Sales volume in North America was
391,000 units, up 4.9% year on year, with
increased volume in the United States on
strong sales of the Mazda6 and CX-5 and
record sales in Mexico. In Europe, although
total demand remained on par with the previ-
ous fiscal year, sales in Germany, Russia, and
the United Kingdom were strong. As a result,
sales volume was 207,000 units, up 20.5%
year on year. In China, the locally manufac-
tured CX-5 drove sales, which were up 12.5%
year on year at 196,000 units. In other mar-
kets, although sales remained strong in
Australia, they declined in Thailand, where
demand was sluggish, and sales volume was
293,000 units, down 2.0% year on year.
In addition, consolidated wholesales rose
5.8%, to 1,115,000 units.
(Net Sales)
Net sales amounted to ¥2,692.2 billion, an
increase of ¥487.0 billion, or 22.1%, over the
previous fiscal year, owing to increasing sales
of SKYACTIV-equipped models in global mar-
kets. The breakdown of consolidated net
sales was an 11.5% increase for domestic
sales, to ¥655.7 billion, and a 25.9% increase
for overseas sales, to ¥2,036.5 billion.
By product, vehicle sales increased ¥426.9
billion (24.3%), to ¥2,180.7 billion, on improve-
ments in sales volume and the product mix.
Sales of knockdown parts for overseas pro-
duction increased ¥14.5 billion (25.8%), to
¥70.4 billion, on an increase in shipments to
China. Sales of parts increased ¥16.8 billion
(8.8%), to ¥206.5 billion, and other sales
were ¥28.8 billion (14.0%) higher, at ¥234.6
billion.
(Operating Income)
Operating income amounted to ¥182.1 billion,
an increase of ¥128.2 billion (237.7%) over the
previous fiscal year. Marketing expenses
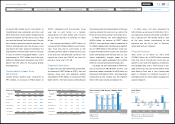
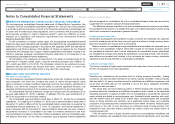
221
307
239
196
230
206 206 216 244
391
207
196
293
372
172
175
300
372
183
223
263
342
212
236
277
Sales Trend by Major Markets
Thousands of units
1,193 1,273 1,247 1,331
1,235
2010 2011 2012 2013 2014
Other markets
China
Europe
North America
Japan
(Years ended March 31)
2,692.2
2,163.9 2,325.7
2,036.5
1,588.9 1,784.2
541.5
2,033.1
1,472.9
560.2
575.0 655.7
2,205.3
1,617.3
588.0
2010 2011 2012 2013 2014
Overseas
Domestic
Net Sales
Billions of yen
(Years ended March 31)
9.5
(6.5)
(60.0) (38.7)
23.8 53.934.3
(107.7)
135.7
182.1
2010 2011 2012 2013 2014
Operating Income (Loss) / Net Income (Loss)
Billions of yen
Operating Income
Net Income
■ Improvement
■ Deterioration
(Years ended March 31) (Years ended March 31)
Volume and
mix
+55.0
YoY +128.2
Foreign
exchange
+112.7
Cost
improvements
+22.0
Marketing
expenses
(19.2) Others
(42.3)
53.9
182.1
Operating Income Change
Billions of yen
2013 2014
37
Mazda Annual Report 2014
CONTENTS
Foundations Underpinning
Sustainable Growth
Financial Section
Review of Operations
Message from Management
Introduction
Brand Value Management