Mazda 2014 Annual Report Download - page 48
Download and view the complete annual report
Please find page 48 of the 2014 Mazda annual report below. You can navigate through the pages in the report by either clicking on the pages listed below, or by using the keyword search tool below to find specific information within the annual report.-
 1
1 -
2
-
3
-
4
-
5
-
6
-
7
-
8
-
9
-
10
-
11
-
12
-
13
-
14
-
15
-
16
-
17
-
18
-
19
-
20
-
21
-
22
-
23
-
24
-
25
-
26
-
27
-
28
-
29
-
30
-
31
-
32
-
33
-
34
-
35
-
36
-
37
-
 38
38 -
 39
39 -
 40
40 -
 41
41 -
 42
42 -
 43
43 -
 44
44 -
 45
45 -
 46
46 -
 47
47 -
 48
48 -
 49
49 -
 50
50 -
 51
51 -
 52
52 -
 53
53 -
 54
54 -
 55
55 -
 56
56 -
 57
57 -
 58
58 -
59
-
60
-
61
-
62
-
63
-
64
-
65
-
66
-
67
 |
 |
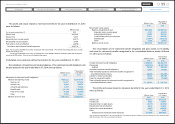
Millions of yen
Thousands of
U.S. dollars
(Note 1)
2014 2013 2014
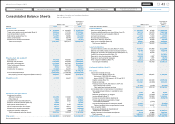
Cash flows from operating activities:
Income before income taxes ¥ 97,409 ¥39,101 $ 945,718
Adjustments to reconcile income before income taxes to
net cash provided by/(used in) operating activities:
Depreciation and amortization 57,656 59,954 559,767
Loss on impairment of fixed assets 2,754 2,795 26,738
Allowance for doubtful receivables (1,364) 113 (13,243)
Reserve for warranty expenses 3,454 (4,552) 33,534
Employees' severance and retirement benefits —(5,739) —
Reserve for loss from business of affiliates 37,292 (714) 362,058
Reserve for environmental measures 8 60 78
Increase/(decrease) in liability for retirement benefits (1,546) —(15,010)
Interest and dividend income (2,846) (2,948) (27,631)
Interest expense 12,975 14,062 125,971
Equity in net loss/(income) of affiliated companies (9,677) (10,090) (93,951)
Loss on sale/disposition of property, plant and equipment, net 4,107 2,721 39,874
Loss/(gain) on sale of investment securities, net —(329) —
Gain on sale of investments in affiliates —(9,574) —
Government subsidy —(2,746) —
Decrease/(increase) in trade notes and accounts receivable (1,416) (4,532) (13,748)
Decrease/(increase) in inventories (47,058) (37,187) (456,874)
Increase/(decrease) in trade notes and accounts payable 48,068 33,994 466,680
Increase/(decrease) in other current liabilities 10,006 21,716 97,146
Other (48,572) (20,686) (471,573)
Subtotal 161,250 75,419 1,565,534
Interest and dividends received 3,149 3,075 30,573
Interest paid (13,324) (13,678) (129,359)
Income taxes paid (14,696) (15,783) (142,680)
Net cash provided by/(used in) operating activities ¥136,379 ¥49,033 $1,324,068
See accompanying notes.
Millions of yen
Thousands of
U.S. dollars
(Note 1)
2014 2013 2014
Cash flows from investing activities:
Decrease/(increase) in time deposits ¥ 11 ¥ (70) $ 107
Purchase of investment securities (1,823) (5,097) (17,699)
Proceeds from sales and redemption of investment securities 152 1,166 1,476
Acquisition of property, plant and equipment (110,830) (69,899) (1,076,019)
Proceeds from sale of property, plant and equipment 1,841 16,065 17,874
Proceeds from government subsidy —2,746 —
Acquisition of intangible assets (8,263) (6,110) (80,223)
Decrease/(increase) in short-term loans receivable 4 1,317 39
Long-term loans receivable made (1,235) (467) (11,990)
Collections of long-term loans receivable 274 345 2,660
Sale of investments in subsidiaries affecting scope
of consolidation —19,804 —
Other (188) (87) (1,827)
Net cash provided by/(used in) investing activities (120,057) (40,287) (1,165,602)
Cash flows from financing activities:
Increase/(decrease) in short-term debt (1,100) 25,683 (10,680)
Proceeds from long-term debt 116,048 2,680 1,126,680
Repayment of long-term debt (104,594) (94,727) (1,015,476)
Proceeds from stock issuance to minority shareholders 356 9,364 3,456
Cash dividends paid to the minority shareholders
of consolidated subsidiaries (215) (15) (2,087)
Treasury stock transactions (12) (2) (116)
Other —(164) —
Net cash provided by/(used in) financing activities 10,483 (57,181) 101,777
Effect of exchange rate fluctuations on cash and
cash equivalents 8,074 15,041 78,388
Net increase/(decrease) in cash and cash equivalents 34,879 (33,394) 338,631
Cash and cash equivalents at beginning of the year 444,875 477,307 4,319,175
Increase in cash and cash equivalents due to change
of scope of consolidation — 962 —
Cash and cash equivalents at end of the year ¥479,754 ¥444,875 $4,657,806
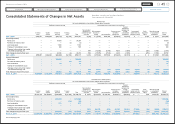
Consolidated Statements of Cash Flows Mazda Motor Corporation and Consolidated Subsidiaries
Years ended March 31, 2014 and 2013
46
Mazda Annual Report 2014
CONTENTS
Foundations Underpinning
Sustainable Growth
Financial Section
Review of Operations
Message from Management
Introduction
Brand Value Management