Mazda 2014 Annual Report Download - page 62
Download and view the complete annual report
Please find page 62 of the 2014 Mazda annual report below. You can navigate through the pages in the report by either clicking on the pages listed below, or by using the keyword search tool below to find specific information within the annual report.-
 1
1 -
2
-
3
-
4
-
5
-
6
-
7
-
8
-
9
-
10
-
11
-
12
-
13
-
14
-
15
-
16
-
17
-
18
-
19
-
20
-
21
-
22
-
23
-
24
-
25
-
26
-
27
-
28
-
29
-
30
-
31
-
32
-
33
-
34
-
35
-
36
-
37
-
38
-
39
-
40
-
41
-
42
-
43
-
44
-
45
-
46
-
47
-
48
-
49
-
50
-
51
-
 52
52 -
 53
53 -
 54
54 -
 55
55 -
 56
56 -
 57
57 -
 58
58 -
 59
59 -
 60
60 -
 61
61 -
 62
62 -
 63
63 -
 64
64 -
 65
65 -
 66
66 -
 67
67
 |
 |

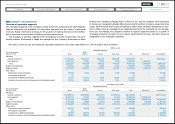
17 SEGMENT INFORMATION
Overview of reportable segments
The reportable segments of the Company consist of business components for which separate
financial statements are available. The reportable segments are the subject of periodical
review by Board of Directors meetings for the purpose of making decisions on the distribu-
tion of corporate resources and evaluating business performance.
The Company is primarily engaged in the manufacture and sale of passenger and com-
mercial vehicles. Businesses in Japan are managed by the Company. Businesses in North
America are managed by Mazda Motor of America, Inc. and the Company. And businesses
in Europe are managed by Mazda Motor Europe GmbH and the Company. Areas other than
Japan, North America and Europe are defined as Other areas. Business deployment in coun-
tries in Other areas are managed in an integrated manner by the Company as one manage-
ment unit. Accordingly, the Company consists of regional segments based on a system of
managing production and sale. As such, Japan, North America, Europe, and Other areas are
designated as four reportable segments.
Net sales, income or loss, and assets by reportable segments for the years ended March 31, 2014 and 2013 were as follows:
Millions of yen
Reportable segments
Adjustment (*1) Consolidated (*2)
For the year ended
March 31, 2014 Japan
North
America Europe Other areas Total
Net sales:
Outside customers ¥ 925,638 ¥832,105 ¥529,100 ¥405,395 ¥2,692,238 ¥ — ¥2,692,238
Inter-segment 1,337,632 11,529 11,432 8,794 1,369,387 (1,369,387) —
Total 2,263,270 843,634 540,532 414,189 4,061,625 (1,369,387) 2,692,238
Segment income/(loss) 173,500 1,324 8,466 5,803 189,093 (6,972) 182,121
Segment assets 1,791,383 406,254 195,196 195,481 2,588,314 (342,278) 2,246,036
Other items:
Depreciation and amortization 50,543 2,694 3,282 1,109 57,628 — 57,628
Amortization of goodwill 28 — — — 28 — 28
In vestments in affiliated companies 17,005 42,473 3,748 70,993 134,219 — 134,219
In crease in property, plant and equipment and intangible assets 70,302 54,394 1,519 7,001 133,216 — 133,216
Thousands of U.S. dollars
Reportable segments
Adjustment (*1) Consolidated (*2)
For the year ended
March 31, 2014 Japan
North
America Europe Other areas Total
Net sales:
Outside customers $ 8,986,777 $8,078,689 $5,136,893 $3,935,874 $26,138,233 $ — $26,138,233
Inter-segment 12,986,718 111,932 110,990 85,379 13,295,019 (13,295,019) —
Total 21,973,495 8,190,621 5,247,883 4,021,253 39,433,252 (13,295,019) 26,138,233
Segment income/(loss) 1,684,466 12,854 82,194 56,340 1,835,854 (67,689) 1,768,165
Segment assets 17,392,068 3,944,214 1,895,107 1,897,874 25,129,263 (3,323,087) 21,806,176
Other items:
Depreciation and amortization 490,709 26,155 31,864 10,767 559,495 — 559,495
Amortization of goodwill 272 — — — 272 — 272
In vestments in affiliated companies 165,097 412,359 36,388 689,252 1,303,096 — 1,303,096
In crease in property, plant and equipment and intangible assets 682,544 528,097 14,747 67,971 1,293,359 — 1,293,359
60
Mazda Annual Report 2014
CONTENTS
Foundations Underpinning
Sustainable Growth
Financial Section
Review of Operations
Message from Management
Introduction
Brand Value Management