Mazda 2014 Annual Report Download - page 59
Download and view the complete annual report
Please find page 59 of the 2014 Mazda annual report below. You can navigate through the pages in the report by either clicking on the pages listed below, or by using the keyword search tool below to find specific information within the annual report.-
 1
1 -
2
-
3
-
4
-
5
-
6
-
7
-
8
-
9
-
10
-
11
-
12
-
13
-
14
-
15
-
16
-
17
-
18
-
19
-
20
-
21
-
22
-
23
-
24
-
25
-
26
-
27
-
28
-
29
-
30
-
31
-
32
-
33
-
34
-
35
-
36
-
37
-
38
-
39
-
40
-
41
-
42
-
43
-
44
-
45
-
46
-
47
-
48
-
 49
49 -
 50
50 -
 51
51 -
 52
52 -
 53
53 -
 54
54 -
 55
55 -
 56
56 -
 57
57 -
 58
58 -
 59
59 -
 60
60 -
 61
61 -
 62
62 -
 63
63 -
 64
64 -
 65
65 -
 66
66 -
 67
67
 |
 |

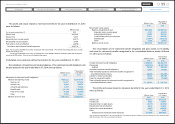
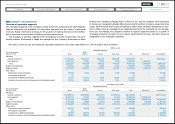
13 OTHER INCOME / (EXPENSES)
The components of “Other, net” in Other income/(expenses) in the consolidated statements
of income for the years ended March 31, 2014 and 2013 were comprised as follows:
Millions of yen
Thousands of
U.S. dollars
For the years ended March 31 2014 2013 2014
Gain on sale of investment in affiliates, net ¥ — ¥ 9,574 $ —
Loss on retirement and sale of property, plant and
equipment, net (4,230) (2,825) (41,068)
Rental income 2,910 2,088 28,252
Loss on sale of receivables (972) (813) (9,437)
Loss on impairment of long-lived assets (2,754) (2,795) (26,738)
Foreign exchange gain/(loss) (42,215) (19,538) (409,854)
Government subsidy — 2,746 —
Subsidy income(*1) 224 — 2,175
Compensation received for the exercise
of eminent domain 123 104 1,194
Reserve for loss from business of affiliates(*2) (36,616) — (355,495)
Reserve for environment measures (8) (60) (78)
Business restructuring costs(*3) — (1,212) —
Other (722) (1,080) (7,009)
Total ¥(84,260) ¥(13,811) $(818,058)
(*1) Restoration and construction subsidy for facilities and equipment of small and medium enterprises in Fukushima pre-
fecture, which was granted to our consolidated subsidiary, affected by the Great East Japan Earthquake.
(*2) Reserve for loss related to the losses of domestic and foreign subsidiaries’ and affiliates’ businesses.
(*3) Retirement benefits in some foreign consolidated subsidiaries and compensation payments to some dealers to imple-
ment structural reforms.
14 INCOME TAXES
The effective tax rate reflected in the consolidated statements of income for the years
ended March 31, 2014 and 2013 differs from the statutory tax rate for the following reasons.
For the years ended March 31 2014 2013
Statutory tax rate 37.8 % 37.8%
Valuation allowance (74.3) (31.3)
Equity in net income of affiliated companies (3.8) (9.7)
Effect of adjustment of gain on sales of stock for
subsidiaries and affiliates — 17.1
Decrease in deferred tax assets at end of year due to the
change in tax rate 3.5 —
Other (0.2) (2.1)
Effective tax rate (37.0)% 11.8%
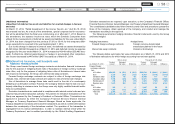
Deferred tax assets and liabilities reflect the estimated tax effects of loss carryforwards
and accumulated temporary differences between assets and liabilities for financial
accounting purposes and those for tax purposes. The significant components of deferred
tax assets and liabilities as of March 31, 2014 and 2013 were as follows:
Millions of yen
Thousands of
U.S. dollars
As of March 31 2014 2013 2014
Deferred tax assets:
Allowance for doubtful receivables ¥ 1,226 ¥ 1,528 $ 11,903
Employees' severance and retirement benefits —23,417 —
Liability for retirement benefits 24,034 —233,340
Loss on impairment of long-lived assets 4,539 5,308 44,068
Accrued bonuses and other reserves 33,734 19,226 327,515
Inventory valuation 5,659 6,613 54,942
Valuation loss on investment securities, etc. 1,405 1,399 13,641
Deferred gains/(losses) on hedges 672 9,043 6,524
Net operating loss carryforwards 88,189 119,359 856,204
Other 36,770 46,082 356,990
Total gross deferred tax assets 196,228 231,975 1,905,127
Less valuation allowance (84,089) (162,737) (816,398)
Total deferred tax assets 112,139 69,238 1,088,729
Deferred tax liabilities:
Asset retirement cost corresponding to asset
retirement obligations, and others (5,841) (7,050) (56,709)
Net deferred tax assets ¥106,298 ¥ 62,188 $1,032,020
The net deferred tax assets are included in the following accounts in the consolidated
balance sheets:
Millions of yen
Thousands of
U.S. dollars
As of March 31 2014 2013 2014
Current assets—Deferred tax assets ¥ 54,897 ¥59,999 $ 532,981
Investments and other assets—Deferred tax assets 54,189 5,155 526,107
Current liabilities—Other current liabilities (59) (38) (573)
Long-term liabilities—Other long-term liabilities (2,729) (2,928) (26,495)
Net deferred tax assets ¥106,298 ¥62,188 $1,032,020
57
Mazda Annual Report 2014
CONTENTS
Foundations Underpinning
Sustainable Growth
Financial Section
Review of Operations
Message from Management
Introduction
Brand Value Management