Mazda 2014 Annual Report Download - page 40
Download and view the complete annual report
Please find page 40 of the 2014 Mazda annual report below. You can navigate through the pages in the report by either clicking on the pages listed below, or by using the keyword search tool below to find specific information within the annual report.-
 1
1 -
2
-
3
-
4
-
5
-
6
-
7
-
8
-
9
-
10
-
11
-
12
-
13
-
14
-
15
-
16
-
17
-
18
-
19
-
20
-
21
-
22
-
23
-
24
-
25
-
26
-
27
-
28
-
29
-
 30
30 -
 31
31 -
 32
32 -
 33
33 -
 34
34 -
 35
35 -
 36
36 -
 37
37 -
 38
38 -
 39
39 -
 40
40 -
 41
41 -
 42
42 -
 43
43 -
 44
44 -
 45
45 -
 46
46 -
 47
47 -
 48
48 -
 49
49 -
 50
50 -
51
-
52
-
53
-
54
-
55
-
56
-
57
-
58
-
59
-
60
-
61
-
62
-
63
-
64
-
65
-
66
-
67
 |
 |
increased ¥19.2 billion due to such factors as
strengthened sales promotion activities, and
other fixed costs increased ¥42.3 billion due to
growth investment for the future, such as R&D
cost and the Mexico Plant launch cost. Despite
these factors, operating income showed a sig-
nificant improvement over the previous fiscal
year due to the sales volume and product mix
improvement of ¥55.0 billion from an increase
in sales of SKYACTIV-equipped models, a cost
improvement of ¥22.0 billion due to the pro-
motion of Monotsukuri Innovation, and ¥112.7
billion from the effect of fluctuating foreign
exchange rates.
(Income before Income Taxes,
Net Income)
Income before income taxes amounted to
¥97.4 billion, an increase of ¥58.3 billion, or
149.1%, compared with the previous fiscal
year, due to such factors as a foreign
exchange loss of ¥42.2 billion and a reserve
for loss from business of affiliates of ¥36.6
billion.
Net income amounted to ¥135.7 billion, an
increase of ¥101.4 billion (295.6%) over the pre-
vious fiscal year, due to such factors as the
recording of ¥40.1 billion in deferred tax assets
at an overseas consolidated subsidiary. Net
income per share was ¥45.40, up from the
previous fiscal year’s ¥11.48.
(Segment Information)
In Japan, net sales amounted to ¥2,263.3 billion,
an increase of ¥369.7 billion, or 19.5%, over the
previous fiscal year, and operating income
amounted to ¥173.5 billion, an increase of ¥65.1
billion (60.1%). The main factors contributing to
the increase were the improvements in the sales
volume, product mix and, costs as well as the
effect of fluctuating foreign exchange rates.
In North America, net sales amounted to
¥843.6 billion, an increase of ¥193.7 billion
(29.8%), and operating income amounted to
¥1.3 billion, following the recording of a segment
loss of ¥48.9 billion in the previous fiscal year.
Despite the Mexico Plant launch cost, the main
factor contributing to the increase was U.S. sub-
sidiary profitability, brought about by the
improved sales volume and product mix and the
effect of fluctuating foreign exchange rates.
In Europe, net sales amounted to ¥540.5 bil-
lion, an increase of ¥185.8 billion (52.4%), and
operating income amounted to ¥8.5 billion, an
increase of ¥5.3 billion (171.2%). The main factor
contributing to the increase was the improve-
ment in the sales volume and product mix.
In other areas, net sales amounted to
¥414.2 billion, a decrease of ¥4.5 billion (1.1%),
and operating income amounted to ¥5.8 bil-
lion, a decrease of ¥11.0 billion (65.5%). One
of the main factors contributing to the
decrease was the fall in sales in Thailand,
where demand was stagnant.
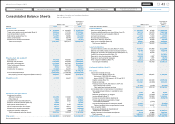
(Financial Position)
Total assets as of March 31, 2014, were
¥2,246.0 billion, for a ¥267.5 billion increase
from the end of the previous fiscal year on
growth in cash and time deposits, inventories,
and tangible fixed assets. The increase in tan-
gible fixed assets was due to investment in the
new Mexico Plant and a new transmission
plant in Thailand to reinforce business in
emerging countries and establish a global pro-
duction footprint.
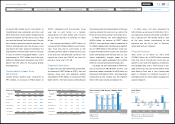
Sales by Segment* Billions of yen
(Years ended
March 31) 2010 2011 2012 2013 2014
Japan 1,867.2 1,999.5 1,745.0 1,893.6 2,263.3
North America 572.1 631.0 571.6 650.0 843.6
Europe 488.7 438.2 360.4 354.8 540.5
Other markets 225.2 310.4 294.2 418.7 414.2
Adjustment (989.3) (1,053.4) (938.1) (1,111.8) (1,369.4)
Consolidated 2,163.9 2,325.7 2,033.1 2,205.3 2,692.2
Operating Income (Loss) by Segment* Billions of yen
(Years ended
March 31) 2010 2011 2012 2013 2014
Japan 30.8 32.6 (18.4) 108.4 173.5
North America (19.3) (31.7) (40.3) (48.9) 1.3
Europe 3.5 7.9 5.6 3.1 8.5
Other markets 5.4 12.8 10.1 16.8 5.8
Adjustment (10.9) 2.2 4.3 (25.5) (7.0)
Consolidated 9.5 23.8 (38.7) 53.9 182.1
67.4
1.6
(79.4)
8.7 16.3
111.6
(44.3) (13.7) (9.1)
(70.3)
15.3
49.0
(40.3)
(120.1)
136.4
2010 2011 2012 2013 2014
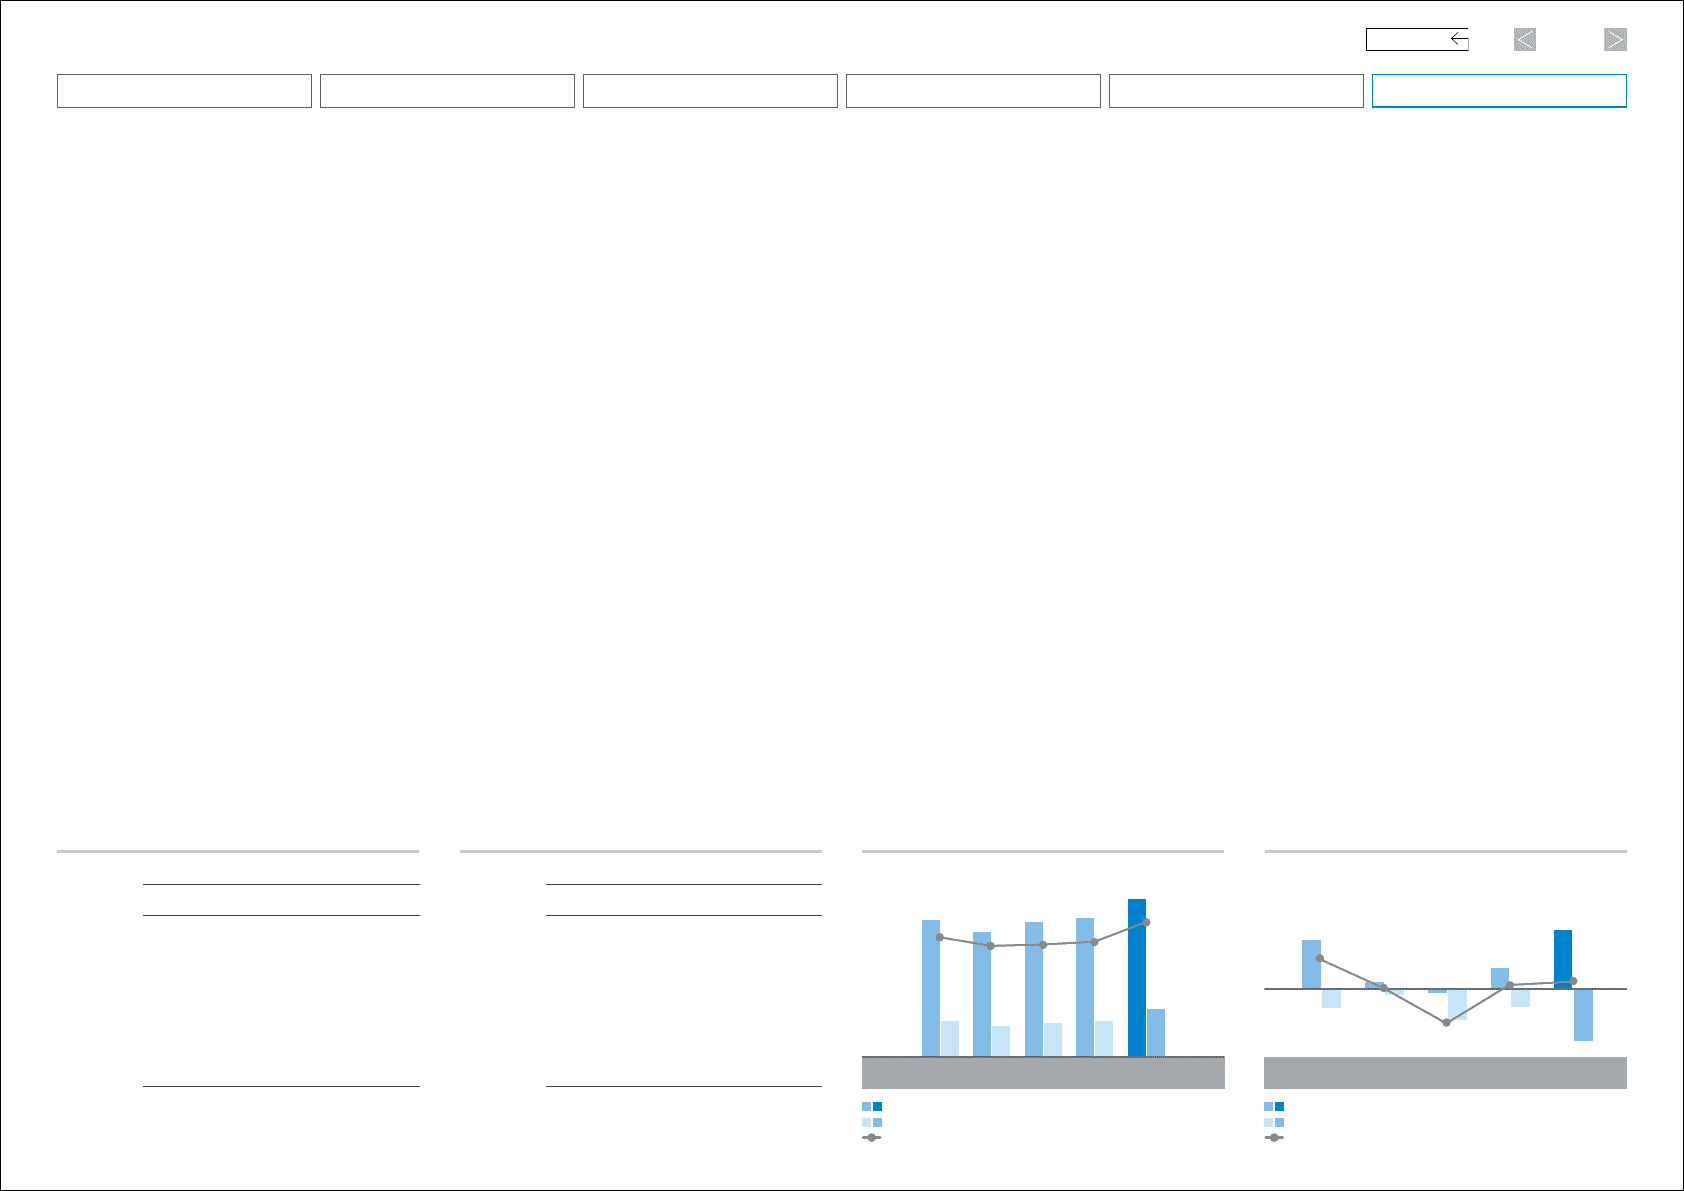
Cash Flows
Billions of yen
1,947.8
1,771.8 1,915.9 1,978.6
676.8
513.2
474.4
430.5
509.8
2,246.0
2010 2011 2012 2013 2014
29.4
25.1
24.5
24.2
26.1
Total Assets / Net Assets / Equity Ratio
Billions of yen / %
Total Assets
Net Assets
Equity Ratio
Cash Flow from Operating Activities
Cash Flow from Investing Activities
Free Cash Flow
(As of March 31) (Years ended March 31)
* Net sales by geographic area based on reportable segments * Operating income by geographic area based on reportable segments
38
Mazda Annual Report 2014
CONTENTS
Foundations Underpinning
Sustainable Growth
Financial Section
Review of Operations
Message from Management
Introduction
Brand Value Management