Mazda 2014 Annual Report Download - page 41
Download and view the complete annual report
Please find page 41 of the 2014 Mazda annual report below. You can navigate through the pages in the report by either clicking on the pages listed below, or by using the keyword search tool below to find specific information within the annual report.-
 1
1 -
2
-
3
-
4
-
5
-
6
-
7
-
8
-
9
-
10
-
11
-
12
-
13
-
14
-
15
-
16
-
17
-
18
-
19
-
20
-
21
-
22
-
23
-
24
-
25
-
26
-
27
-
28
-
29
-
30
-
 31
31 -
 32
32 -
 33
33 -
 34
34 -
 35
35 -
 36
36 -
 37
37 -
 38
38 -
 39
39 -
 40
40 -
 41
41 -
 42
42 -
 43
43 -
 44
44 -
 45
45 -
 46
46 -
 47
47 -
 48
48 -
 49
49 -
 50
50 -
 51
51 -
52
-
53
-
54
-
55
-
56
-
57
-
58
-
59
-
60
-
61
-
62
-
63
-
64
-
65
-
66
-
67
 |
 |

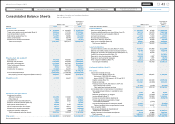
Total liabilities amounted to ¥1,569.2 billion,
an increase of ¥103.9 billion compared with the
end of the previous fiscal year, mainly reflect-
ing an increase in trade notes and accounts
payable as well as an increase in interest-bear-
ing debt, which increased by ¥23.8 billion from
the previous fiscal year. After deducting ¥479.8
billion in cash and cash equivalents at end of
period from interest-bearing debt, net interest-
bearing debt totaled ¥263.0 billion, a decrease
of ¥11.1 billion from the end of the previous fis-
cal year. The net debt-to-equity ratio improved
15.4 percentage points, to 39.8% (32.8% after
the recognition of the equity credit attributes
of the subordinated loans).
Net assets amounted to ¥676.8 billion, an
increase of ¥163.6 billion compared with the
end of the previous fiscal year, due mainly to
¥135.7 billion of net income. The equity ratio
increased by 4.3 percentage points from the
end of the previous fiscal year, to 29.4%.
(31.0% after the recognition of the equity
credit attributes of the subordinated loans).
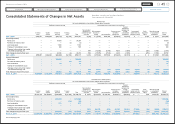
(Cash Flows)
Net cash provided by operating activities was
¥136.4 billion, reflecting such components as
income before income taxes of ¥97.4 billion,
depreciation and amortization of ¥57.7 billion,
and income taxes paid of ¥14.7 billion. (In the
previous fiscal year, net cash provided by oper-
ating activities had amounted to ¥49.0 billion.)
Net cash used in investing activities was ¥120.1
billion, mainly reflecting capital expenditure
for the acquisition of tangible fixed assets,
such as facility investments in the new Mexico
Plant, of ¥110.8 billion. (In the previous fiscal
year, net cash used in investing activities had
amounted to ¥40.3 billion.)
As a result, consolidated free cash flow
(the total net cash flow from operating activi-
ties and investing activities) was positive in
the amount of ¥16.3 billion. (For the previous
fiscal year, consolidated free cash flow had
been positive in the amount of ¥8.7 billion.)
Despite making ongoing growth investments
for the future, a positive free cash flow is
being maintained.
Net cash provided by financing activities
was ¥10.5 billion, mainly reflecting proceeds
from long-term loans payable of ¥116.0 billion
partially offset by repayment of long-term
loans payable and redemption of bonds. (For
the previous fiscal year, net cash used in financ-
ing activities had amounted to ¥57.2 billion.)
(Consolidation of Shares and Change in
Number of Shares per Share Unit)
At the 148th Ordinary General Meeting of
Shareholders held on June 24, 2014, proposals
were approved relating to the consolidation of
shares (at a rate of one share for every five
shares) and a change in the number of shares
per share unit (changed from 1,000 shares to
100 shares). The consolidation of shares took
place on August 1, 2014. Due to the consolida-
tion of shares, the total number of shares
issued became 599,875,479 shares.
(Basic Dividend Policy, Dividends for
March 2014 and March 2015 Fiscal Years)
Mazda’s policy regarding the stock dividend is
to determine the amount of dividend pay-
ments, taking into account such factors as the
current fiscal year’s financial results, business
environment, and financial condition. Mazda is
striving to realize stable shareholder returns
and their future steady increase.
With regard to the dividend for the fiscal
year ended March 31, 2014, we resumed divi-
dend payments for the first time in four fiscal
years, a dividend of ¥1 per share. For the fiscal
year ending March 31, 2015, our current fore-
cast for dividends is ¥10 per share (after con-
sideration of share consolidation with a ratio
of five shares to one share). When converted
to the amount before share consolidation, the
current forecast for dividends is ¥2 per share.
Mazda will be utilizing its internal reserves
to invest in such areas as plant and equip-
ment and for R&D expenses to enhance its
competitiveness.
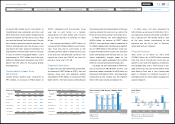
Forecast for the March 2015 Fiscal Year
Billions of yen
(Years ended
March 31) 2014 2015 (Forecast) Difference
Net sales 2,692.2 2,900.0 207.8
Operating
income 182.1 210.0 27.9
Ordinary
income 97.4 200.0 102.6
Net income 135.7 160.0 24.3
(Exchange
assumptions)
US$/Yen 100 100
€/Yen 134 135
Forecast for Global Sales Volume
Thousands of units
(Years ended
March 31) 2014 2015 (Forecast) Difference
Japan 244 230 (14)
North
America 391 440 49
Europe 207 220 13
China 196 230 34
Other markets 293 300 7
Tota l 1,331 1,420 89
39
Mazda Annual Report 2014
CONTENTS
Foundations Underpinning
Sustainable Growth
Financial Section
Review of Operations
Message from Management
Introduction
Brand Value Management