LG 2001 Annual Report Download - page 87
Download and view the complete annual report
Please find page 87 of the 2001 LG annual report below. You can navigate through the pages in the report by either clicking on the pages listed below, or by using the keyword search tool below to find specific information within the annual report.-
 1
1 -
2
-
3
-
4
-
5
-
6
-
7
-
8
-
9
-
10
-
11
-
12
-
13
-
14
-
15
-
16
-
17
-
18
-
19
-
20
-
21
-
22
-
23
-
24
-
25
-
26
-
27
-
28
-
29
-
30
-
31
-
32
-
33
-
34
-
35
-
36
-
37
-
38
-
39
-
40
-
41
-
42
-
43
-
44
-
45
-
46
-
47
-
48
-
49
-
50
-
51
-
52
-
53
-
54
-
55
-
56
-
57
-
58
-
59
-
60
-
61
-
62
-
63
-
64
-
65
-
66
-
67
-
68
-
69
-
70
-
71
-
72
-
73
-
74
-
75
-
76
-
 77
77 -
 78
78 -
 79
79 -
 80
80 -
 81
81 -
 82
82 -
 83
83 -
 84
84 -
 85
85 -
 86
86 -
 87
87 -
 88
88 -
 89
89 -
 90
90 -
 91
91 -
 92
92 -
 93
93 -
 94
94 -
 95
95 -
 96
96 -
 97
97 -
98
-
99
 |
 |

LG Electronics Inc. The
43
rd Annual Report
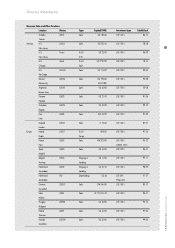
Notes to Financial Statements
for the years ended December 31, 2001 and 2000
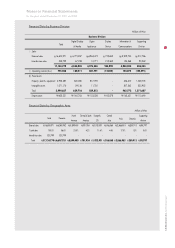
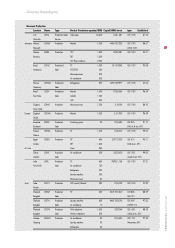
Financial Data by Business Division
Millions of Won
Business Division
Digital Display Digita Display Information & Supporting
Total & Media Appliances Device Communications Division
. Sales
External sales 16,600,971 6,775,357 4,963,473 739,635 3,909,720 212,786
Inter-division sales 523,799 67,728 12,771 215,363 134,368 93,569
17,124,770 6,843,085 4,976,244 954,998 4,044,088 306,355
. Operating income (loss) 795,966 180,211 601,791 (15,020) 184,075 (155,091)
. Fixed assets
Property, plant & equipment 2,923,487 600,580 817,792 - 456,410 1,048,705
Intangible assets 1,071,170 29,136 11,720 - 507,362 522,952
Total 3,994,657 629,716 829,512 - 963,772 1,571,657
Depreciation 625,221 165,704 123,528 82,078 143,421 110,490
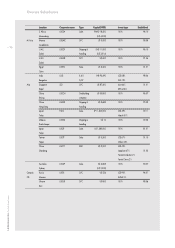
Financial Data by Geographic Area
Million of Won
Total Domestic North Central & South Europe & Central Supporting
America America CIS Asia Asia Oceania division
External sales 16,600,971 6,083,982 3,899,403 701,924 1,932,931 766,068 2,866,953 250,913 98,797
% total sales 100.0% 36.6% 23.5% 4.2% 11.6% 4.6% 17.3% 1.5% 0.6%
Inter-division sales 523,799 523,799 - - - - - -
-
Total 17,124,770 6,607,781 3,899,403 701,924 1,932,931 766,068 2,866,953 250,913 98,797