LG 2001 Annual Report Download - page 17
Download and view the complete annual report
Please find page 17 of the 2001 LG annual report below. You can navigate through the pages in the report by either clicking on the pages listed below, or by using the keyword search tool below to find specific information within the annual report.-
 1
1 -
2
-
3
-
4
-
5
-
6
-
 7
7 -
 8
8 -
 9
9 -
 10
10 -
 11
11 -
 12
12 -
 13
13 -
 14
14 -
 15
15 -
 16
16 -
 17
17 -
 18
18 -
 19
19 -
 20
20 -
 21
21 -
 22
22 -
 23
23 -
 24
24 -
 25
25 -
 26
26 -
 27
27 -
28
-
29
-
30
-
31
-
32
-
33
-
34
-
35
-
36
-
37
-
38
-
39
-
40
-
41
-
42
-
43
-
44
-
45
-
46
-
47
-
48
-
49
-
50
-
51
-
52
-
53
-
54
-
55
-
56
-
57
-
58
-
59
-
60
-
61
-
62
-
63
-
64
-
65
-
66
-
67
-
68
-
69
-
70
-
71
-
72
-
73
-
74
-
75
-
76
-
77
-
78
-
79
-
80
-
81
-
82
-
83
-
84
-
85
-
86
-
87
-
88
-
89
-
90
-
91
-
92
-
93
-
94
-
95
-
96
-
97
-
98
-
99
 |
 |
LG Electronics Inc. The
43
rd Annual Report
Message from CFO
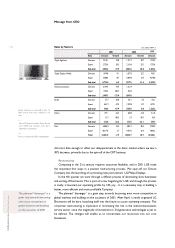
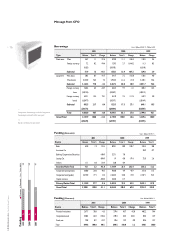
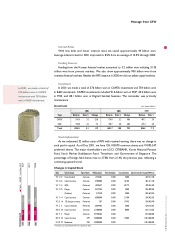
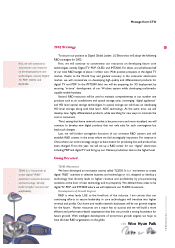
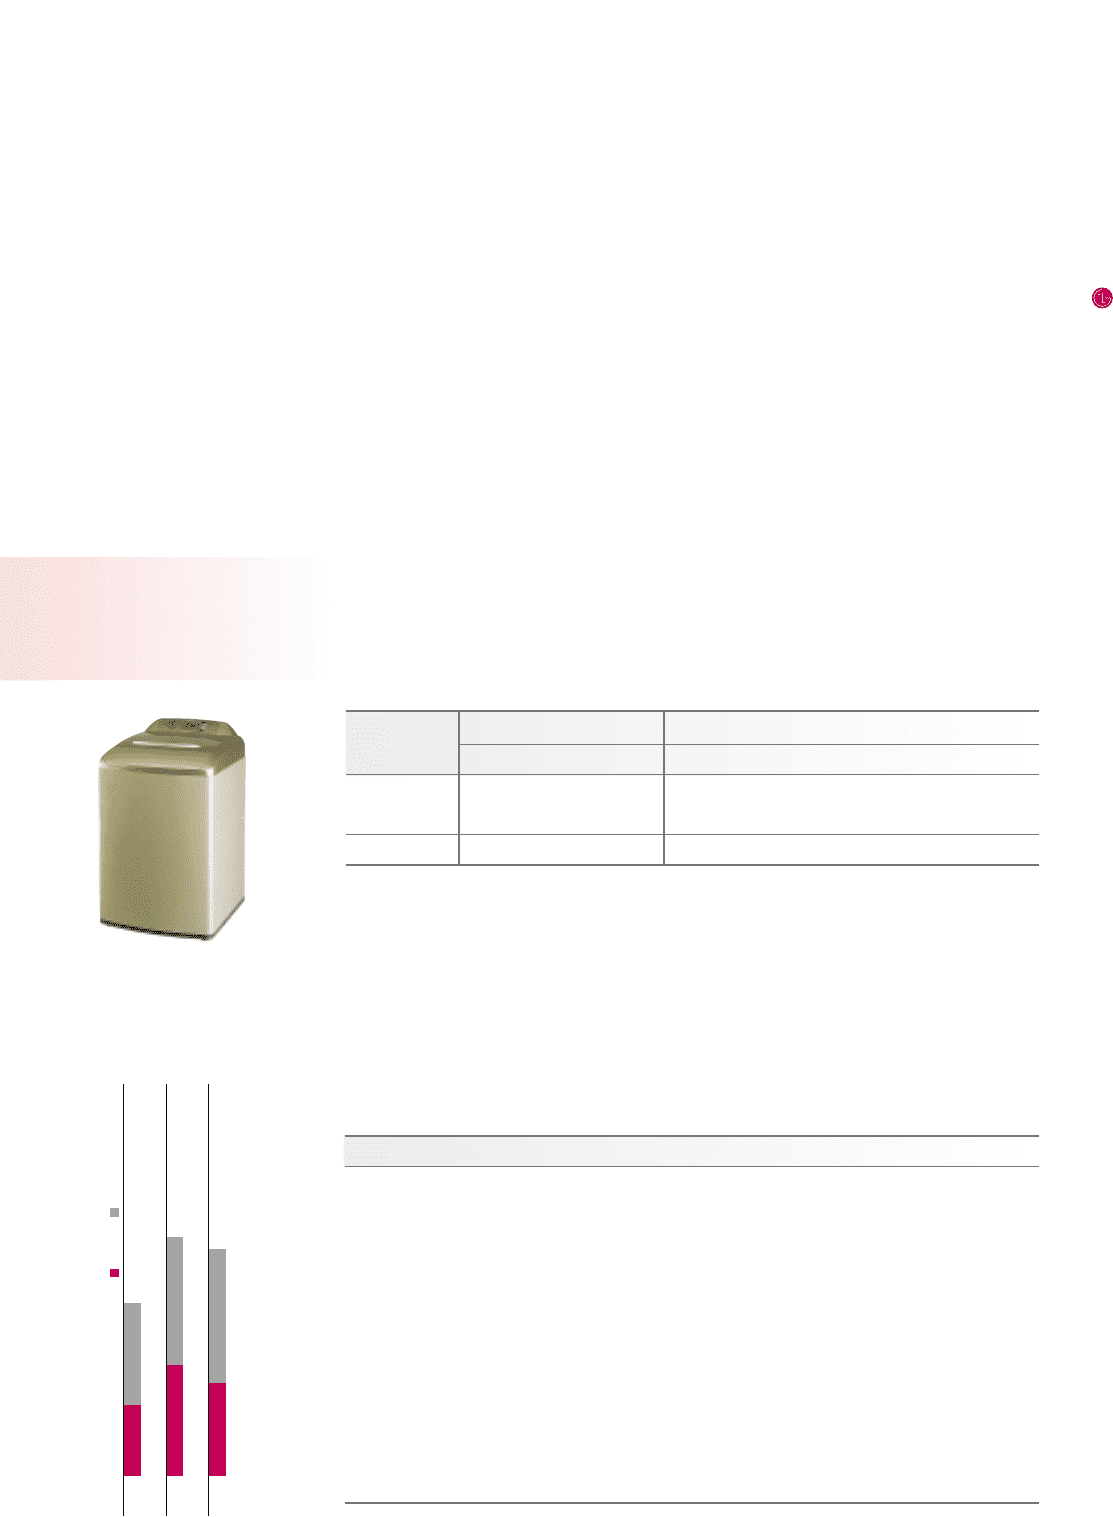
Investment Unit/ Billion KRW
R&D
1999
2000
Capex
2001
407
.
1
776
.
0
576
.
0
419
.
3826
.
4
1
,
481
.
7
1
,
334
.
8
705
.
7
758
.
8
Interest Rates
With less debt and lower interest rates we saved approximately 44 billion won.
Average interest rates for 2001 improved to 8.5% from an average of 10.5% through 2000.
Funding Sources
Funding from the Korean financial market amounted to 3.2 trillion won including 3.135
trillion won from primary markets. We also drew approximately 900 billion won from
overseas financial markets. Besides the RPS issuance in 2000 we did not utilize capital markets.
Investment
In 2001 we made a total of 576 billion won in CAPEX investment and 759 billion won
in R&D investment. CAPEX investments included 91.6 billion won in PDP, 40.2 billion won
in PCB, and 48.1 billion won in Digital Handset business. The remainder was primarily
maintenance.
Stock Information
As we redeemed 32 million units of RPS with retained earning, there was no change in
total paid-in capital. As of Dec 2001, we have 155,118,070 common shares and 19,095,547
preferred shares. The major shareholders are LGCI, CITIBANK, Korea National Pension
Fund, Stock Market Stabilization Fund, Templeton, and Government of Singapore. The
percentage of foreign-held shares rose to 27.8% from 21.4% the previous year, reflecting a
continuing upward trend.
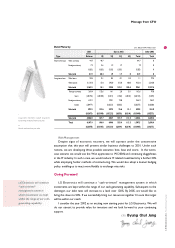
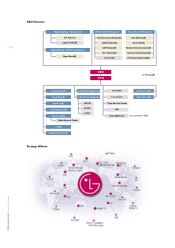
Type Balance Sales % Change Balance Sales % Change Balance Sales %
CAPEX 576.0 3.5 -25.8 776.0 5.2 90.6 407.1 3.9
R&D 758.8 4.6 7.5 705.7 4.8 68.3 419.3 4.0
Total 1,334.8 8.1 -9.9 1,481.7 10.0 79.3 826.4 7.9
2001 2000 1999
Investment Unit : Billion KRW, %
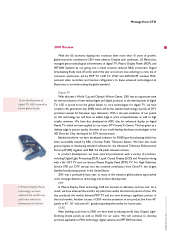
Date Type of change Type of shares Holding shares Face-value(won) Issue price(won) Capital stock after change(1000 won)
93. 2. 27 Stock dividend Common 1,572,681 5,000 5,000 452,911,100
93. 6. 26 Capital increase Common 5,700,000 5,000 10,100 481,411,100
94. 7. 15 GDR Preferred 1,870,657 5,000 30,179 490,764,385
95. 2. 25 Merger Common 2,327,304 5,000 5,000 502,400,905
(Goldstar) Preferred 212,230 5,000 5,000 503,462,055
95. 7. 14 Capital increase Common 6,300,000 5,000 21,700 534,962,055
95. 12. 14 CB, foreign currency Preferred 207 5,000 17,493 534,963,090
97. 5. 6 Capital reduction Preferred -2,069,405 5,000 5,000 524,616,065
98. 12. 24 Capital increase Common 21,500,000 5,000 8,800 632,116,065
00. 9. 4 Merger Common 47,790,404 5,000 871,068,085
00. 12. 23 Capital increase RPS 32,000,000 5,000 17,000 1,031,068,085
01. 07. 27 Redeemed PRS -32,000,000 5,000 1,031,068,085
Changes in Capital Stock
* The dates are standardized with the registration date
In 2001, we made a total of
576 billion won in CAPEX
investment and 759 billion
won in R&D investment.