LG 2001 Annual Report Download - page 83
Download and view the complete annual report
Please find page 83 of the 2001 LG annual report below. You can navigate through the pages in the report by either clicking on the pages listed below, or by using the keyword search tool below to find specific information within the annual report.-
 1
1 -
2
-
3
-
4
-
5
-
6
-
7
-
8
-
9
-
10
-
11
-
12
-
13
-
14
-
15
-
16
-
17
-
18
-
19
-
20
-
21
-
22
-
23
-
24
-
25
-
26
-
27
-
28
-
29
-
30
-
31
-
32
-
33
-
34
-
35
-
36
-
37
-
38
-
39
-
40
-
41
-
42
-
43
-
44
-
45
-
46
-
47
-
48
-
49
-
50
-
51
-
52
-
53
-
54
-
55
-
56
-
57
-
58
-
59
-
60
-
61
-
62
-
63
-
64
-
65
-
66
-
67
-
68
-
69
-
70
-
71
-
72
-
 73
73 -
 74
74 -
 75
75 -
 76
76 -
 77
77 -
 78
78 -
 79
79 -
 80
80 -
 81
81 -
 82
82 -
 83
83 -
 84
84 -
 85
85 -
 86
86 -
 87
87 -
 88
88 -
 89
89 -
 90
90 -
 91
91 -
 92
92 -
 93
93 -
94
-
95
-
96
-
97
-
98
-
99
 |
 |

LG Electronics Inc. The
43
rd Annual Report
Notes to Financial Statements
for the years ended December 31, 2001 and 2000
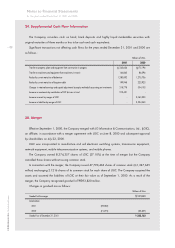
Millions of Won
2001 2000
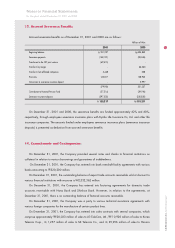
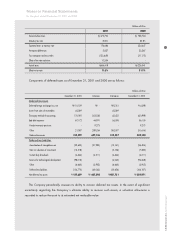
Income before taxes 573,700 728,724
Statutory tax rate 30.8% 30.8%
Expected taxes at statutory rate 176,686 224,447
Permanent differences 2,827 33,267
Tax exemption and tax credits (123,649) (31,173)
Effect of tax rate reduction 10,554 -
Actual taxes 66,418 226,541
Effective tax rate 11.6% 31.1%
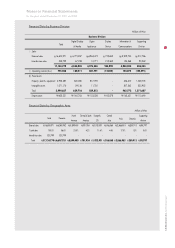
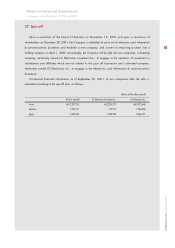
Components of deferred taxes as of December 31, 2001 and 2000 are as follows :
Millions of Won
December 31, 2000 Increases Decreases December 31, 2001
Deferred tax assets
Deferred foreign exchange loss, net 10,159 - 5,761 4,398
Losses from sales of receivables 45,569 - 45,569 -
The equity method of accounting 170,092 303,338 42,432 430,998
Bad debt expenses 67,172 44,991 56,058 56,105
Product warranty provision - 9,273 - 9,273
Other 21,387 289,534 362,537 (51,616)
Deferred tax assets 314,379 647,136 512,357 449,158
Deferred tax liabilities
Amortization of intangible assets (32,635) (31,930) (10,141) (54,424)
Gain on valuation of investments (12,518) - (5,136) (7,382)
Custom duty drawback (4,644) (4,211) (4,644) (4,211)
Reserve for technological development (98,313) - (4,045) (94,268)
Other (6,660) (3,902) (6,660) (3,902)
Deferred tax liabilities (154,770) (40,043) (30,626) (164,187)
Net deferred tax assets 159,609 607,093 481,731 284,971
The Company periodically assesses its ability to recover deferred tax assets. In the event of significant
uncertainty regarding the Company s ultimate ability to recover such assets, a valuation allowance is
recorded to reduce the asset to its estimated net realizable value.