LG 2001 Annual Report Download - page 64
Download and view the complete annual report
Please find page 64 of the 2001 LG annual report below. You can navigate through the pages in the report by either clicking on the pages listed below, or by using the keyword search tool below to find specific information within the annual report.-
 1
1 -
2
-
3
-
4
-
5
-
6
-
7
-
8
-
9
-
10
-
11
-
12
-
13
-
14
-
15
-
16
-
17
-
18
-
19
-
20
-
21
-
22
-
23
-
24
-
25
-
26
-
27
-
28
-
29
-
30
-
31
-
32
-
33
-
34
-
35
-
36
-
37
-
38
-
39
-
40
-
41
-
42
-
43
-
44
-
45
-
46
-
47
-
48
-
49
-
50
-
51
-
52
-
53
-
 54
54 -
 55
55 -
 56
56 -
 57
57 -
 58
58 -
 59
59 -
 60
60 -
 61
61 -
 62
62 -
 63
63 -
 64
64 -
 65
65 -
 66
66 -
 67
67 -
 68
68 -
 69
69 -
 70
70 -
 71
71 -
 72
72 -
 73
73 -
 74
74 -
75
-
76
-
77
-
78
-
79
-
80
-
81
-
82
-
83
-
84
-
85
-
86
-
87
-
88
-
89
-
90
-
91
-
92
-
93
-
94
-
95
-
96
-
97
-
98
-
99
 |
 |
»64
LG Electronics Inc. The
43
rd Annual Report
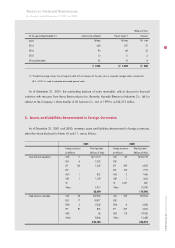
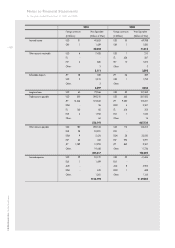
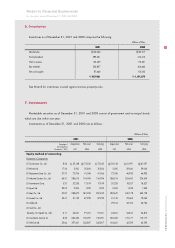
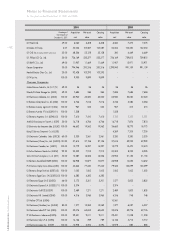
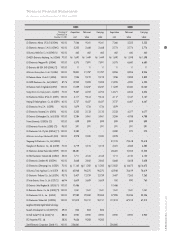
Notes to Financial Statements
for the years ended December 31, 2001 and 2000
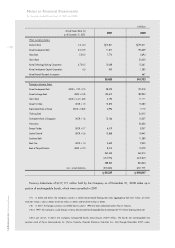
LG Infocomm U.S.A. Inc. (LGICUS) 100.00 4,673 14,818 14,818 4,673 9,045 9,045
LG Infocomm Thailand, Inc. (LGICTH) 60.00 3,246 4,131 4,131 3,246 3,148 3,148
Vietnam Korea Exchange, Ltd.(VKX) 40.00 1,734 1,972 1,972 1,734 1,760 1,760
LG Tops (*2) 40.00 2,699 2,699 2,699 1,799 1,799 1,799
LG Electronics System India, Ltd. (LGSYS)
(formerly, Escorts Communication Ltd.)(*2)
100.00 6,400 6,400 6,400 6,400 6,400 6,400
Electromagnetica Goldstar S.R.L.(*2) 50.00 508 508 508 508 508 508
LG Telecom Corp. (*2) 75.00 369 369 369 369 369 369
SLD TELECOM Pte. Ltd. (*2) 44.00 4,390 4,390 4,390 250 250 250
LG.Philips Displays Holding B.V. 50.00 933,155 706,662 706,662 - - -
LG(Yantai) Information & Communication
Technology Co., Ltd. (*2)
100.00 2,720 2,720 2,720 - - -
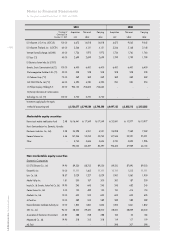
Investments applying for the equity
method of accounting total
5,136,377 3,748,580 3,748,580 4,447,133 3,823,515 3,823,285
Marketable equity securities
Korea stock market stabilization fund 2.48 16,441 17,549 17,549 20,841 10,977 10,977
Hynix Semiconductor Inc. (formerly, Hyundai
Electronics Industries Co., Ltd.) 0.38 24,298 4,551 4,551 24,298 7,569 7,569
Hanaro Telecom Inc. 4.46 147,546 55,763 55,763 147,546 25,591 25,591
Other - 3,740 5,634 5,634 3,740 3,832 1,996
192,025 83,497 83,497 196,425 47,969 46,133
Non-marketable equity securities
Domestic Companies
LG OTIS Elevator Co., Ltd
.
19.90 89,550 88,755 89,550 89,550 87,890 89,550
DreamWiz Inc. 10.00 11,111 1,463 11,111 11,111 1,513 11,111
Lotis Co., Ltd. 18.57 3,029 1,327 3,029 1,900 1,060 1,900
Media Valley Inc. 1.81 300 187 300 300 187 300
Innopla Co., Ltd. (formerly, Sunhan Tech Co., Ltd.)
19.90 245 645 245 245 682 245
Castec Korea Co., Ltd. 5.00 150 489 150 150 414 150
Msoltech Co., Ltd. 10.00 635 242 635 635 635 635
AL Tech Inc. 10.00 589 245 589 589 589 589
Korea Information Certificate Authority Inc. 10.00 1,852 1,860 1,852 1,852 1,841 1,852
STIC Co., Ltd. 94.00 28,200 29,320 28,200 28,200 28,829 28,200
Association of Electronics Environment 40.80 388 208 388 183 23 183
Megaround Co., Ltd. 19.90 318 315 318 119 117 119
MS Tech - - - - 298 307 298
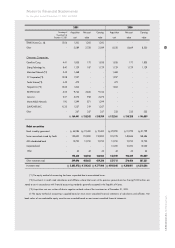
Percentage of
Ownership(%) at
December 31, 2001
2001 2000
Acquisition Net asset Carrying Acquisition Net asset Carrying
cost value value cost value value