LG 2001 Annual Report Download - page 5
Download and view the complete annual report
Please find page 5 of the 2001 LG annual report below. You can navigate through the pages in the report by either clicking on the pages listed below, or by using the keyword search tool below to find specific information within the annual report.-
 1
1 -
 2
2 -
 3
3 -
 4
4 -
 5
5 -
 6
6 -
 7
7 -
 8
8 -
 9
9 -
 10
10 -
 11
11 -
 12
12 -
 13
13 -
 14
14 -
 15
15 -
 16
16 -
17
-
18
-
19
-
20
-
21
-
22
-
23
-
24
-
25
-
26
-
27
-
28
-
29
-
30
-
31
-
32
-
33
-
34
-
35
-
36
-
37
-
38
-
39
-
40
-
41
-
42
-
43
-
44
-
45
-
46
-
47
-
48
-
49
-
50
-
51
-
52
-
53
-
54
-
55
-
56
-
57
-
58
-
59
-
60
-
61
-
62
-
63
-
64
-
65
-
66
-
67
-
68
-
69
-
70
-
71
-
72
-
73
-
74
-
75
-
76
-
77
-
78
-
79
-
80
-
81
-
82
-
83
-
84
-
85
-
86
-
87
-
88
-
89
-
90
-
91
-
92
-
93
-
94
-
95
-
96
-
97
-
98
-
99
 |
 |

LG Electronics Inc. The
43
rd Annual Report
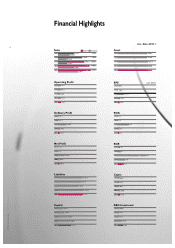
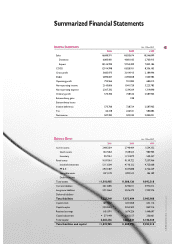
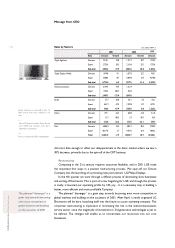
Summarized Financial Statements
Unit : Million KRW
2001 2000 1999
Sales 16,600,971 14,835,674 10,546,099
Domestic 6,083,981 4,881,185 2,703,913
Export 10,516,990 9,954,489 7,842,186
COGS 12,914,998 11,820,761 8,356,103
Gross profit 3,685,973 3,014,913 2,189,996
SG&A 2,890,007 2,093,828 1,505,984
Operating profit 795,966 921,085 684,012
Non-operating income 2,145,066 1,041,720 3,223,783
Non-operating expense 2,367,332 1,234,269 1,319,890
Ordinary profit 573,700 728,536 2,587,905
Extraordinary gains 188
Extraordinary losses
Income before tax 573,700 728,724 2,587,905
Tax 66,418 226,541 582,884
Net income 507,282 502,183 2,005,021
Unit : Million KRW
2001 2000 1999
Current assets 2,485,024 2,740,404 1,534,352
Quick assets 1,527,063 1,548,525 983,905
Inventory 957,961 1,191,879 550,447
Fixed assets 9,107,961 9,139,722 7,557,966
Invested investment 5,113,304 4,710,122 4,725,608
PP & E 2,923,487 3,337,088 2,726,249
Intangible assets 1,071,170 1,092,512 106,109
Deferred assets
Total assets 11,592,985 11,880,126 9,092,318
Current liabilities 4,614,085 5,296,011 3,972,012
Long-term liabilities 2,713,664 2,576,473 1,933,976
Deferred liabilities
Total liabilities 7,327,749 7,872,484 5,905,988
Capital stock 1,031,068 1,031,068 632,116
Capital surplus 2,353,626 2,354,505 862,916
Retained earnings 1,451,991 1,674,226 1,440,697
Capital adjustment ▲571,449 ▲1,052,157 250,601
Total capital 4,265,236 4,007,642 3,186,330
Total liabilities and capital 11,592,985 11,880,126 9,092,318
Income Statement
Balance Sheet