LG 2001 Annual Report Download - page 61
Download and view the complete annual report
Please find page 61 of the 2001 LG annual report below. You can navigate through the pages in the report by either clicking on the pages listed below, or by using the keyword search tool below to find specific information within the annual report.-
 1
1 -
2
-
3
-
4
-
5
-
6
-
7
-
8
-
9
-
10
-
11
-
12
-
13
-
14
-
15
-
16
-
17
-
18
-
19
-
20
-
21
-
22
-
23
-
24
-
25
-
26
-
27
-
28
-
29
-
30
-
31
-
32
-
33
-
34
-
35
-
36
-
37
-
38
-
39
-
40
-
41
-
42
-
43
-
44
-
45
-
46
-
47
-
48
-
49
-
50
-
 51
51 -
 52
52 -
 53
53 -
 54
54 -
 55
55 -
 56
56 -
 57
57 -
 58
58 -
 59
59 -
 60
60 -
 61
61 -
 62
62 -
 63
63 -
 64
64 -
 65
65 -
 66
66 -
 67
67 -
 68
68 -
 69
69 -
 70
70 -
 71
71 -
72
-
73
-
74
-
75
-
76
-
77
-
78
-
79
-
80
-
81
-
82
-
83
-
84
-
85
-
86
-
87
-
88
-
89
-
90
-
91
-
92
-
93
-
94
-
95
-
96
-
97
-
98
-
99
 |
 |

LG Electronics Inc. The
43
rd Annual Report
Notes to Financial Statements
for the years ended December 31, 2001 and 2000
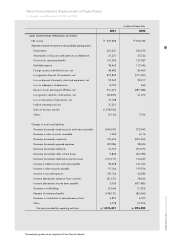
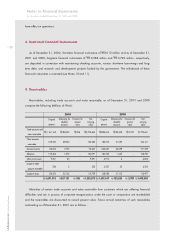
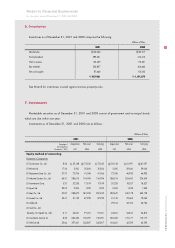
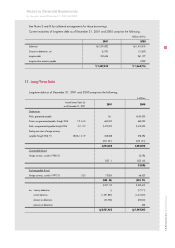
6. Inventories
Inventories as of December 31, 2001 and 2000 comprise the following
Millions of Won
2001 2000
Merchandise 22,646 33,517
Finished products 390,461 474,415
Work in process 132,349 172,231
Raw materials 324,837 406,664
Parts and supplies 87,668 105,052
957,961 1,191,879
See Note 8 for inventories insured against various property risks.
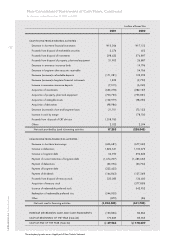
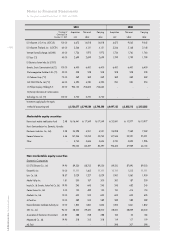
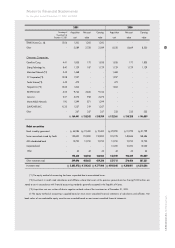
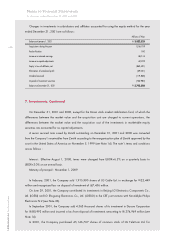
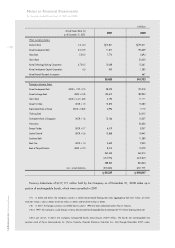
7. Investments
Marketable securities as of December 31, 2001 and 2000 consist of government and municipal bonds
which are due within one year.
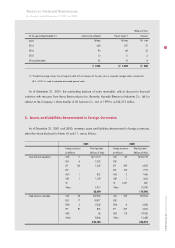
Investments as of December 31, 2001 and 2000 are as follows :
Millions of Won
2001 2000
Acquisition Net asset Carrying Acquisition Net asset Carrying
cost value value cost value value
Equity method of accounting
Domestic Companies
LG Construction Co., Ltd. 8.56 35,148 73,542 73,542 35,148 61,091 61,091
LG Micron Ltd. 17.24 5,000 30,854 30,854 5,000 29,040 29,040
LG Department Store Co., Ltd. 57.70 72,706 41,056 41,056 72,706 46,933 46,933
LG Industrial Systems Co., Ltd. 63.51 286,015 154,784 154,784 286,015 224,600 224,600
LG International Corp. 3.20 20,253 17,819 17,819 20,253 18,527 18,527
LG Sports Ltd. 39.25 2,204 1,935 1,935 2,204 1,949 1,949
LG Mart Co., Ltd. 50.00 283,672 381,235 381,235 283,672 340,178 340,178
LG Innotek Co., Ltd. 53.41 31,135 87,929 87,929 31,135 79,062 79,062
LG Cable Ltd. - - - - 29,313 52,724 52,724
LG Card Co., Ltd.
(formerly, LG Capital Co., Ltd.) 6.17 24,651 91,021 91,021 24,651 54,810 54,810
LG Investments Security Inc. 8.56 262,432 150,091 150,091 262,432 170,177 170,177
LG TeleCom Ltd. 35.64 397,421 242,807 242,807 165,641 42,293 42,293
Percentage of
Ownership(%) at
December 31, 2001