LG 2001 Annual Report Download - page 16
Download and view the complete annual report
Please find page 16 of the 2001 LG annual report below. You can navigate through the pages in the report by either clicking on the pages listed below, or by using the keyword search tool below to find specific information within the annual report.-
 1
1 -
2
-
3
-
4
-
5
-
 6
6 -
 7
7 -
 8
8 -
 9
9 -
 10
10 -
 11
11 -
 12
12 -
 13
13 -
 14
14 -
 15
15 -
 16
16 -
 17
17 -
 18
18 -
 19
19 -
 20
20 -
 21
21 -
 22
22 -
 23
23 -
 24
24 -
 25
25 -
 26
26 -
27
-
28
-
29
-
30
-
31
-
32
-
33
-
34
-
35
-
36
-
37
-
38
-
39
-
40
-
41
-
42
-
43
-
44
-
45
-
46
-
47
-
48
-
49
-
50
-
51
-
52
-
53
-
54
-
55
-
56
-
57
-
58
-
59
-
60
-
61
-
62
-
63
-
64
-
65
-
66
-
67
-
68
-
69
-
70
-
71
-
72
-
73
-
74
-
75
-
76
-
77
-
78
-
79
-
80
-
81
-
82
-
83
-
84
-
85
-
86
-
87
-
88
-
89
-
90
-
91
-
92
-
93
-
94
-
95
-
96
-
97
-
98
-
99
 |
 |
Domestic
Unit : Billion KRW, %
Source Balance Total % Change Balance Total % Change Balance Total %
Bank 62.0 1.9 -92.6 839.1 18.0 244.7 243.4 8.8
Insurance Co. 20.0 0.7
Banking Corporations/Securities -100.0 327.1 7.0
Leasing Co. -100.0 1.9 0.0 -97.4 72.8 2.6
Others 11.1 0.3 -33.9 16.8 0.4
Secondary Market Total
73.1 2.3 -93.8 1,184.9 25.5 252.4 336.2 12.2
Corporate bond (private) 660.0 20.6 43.5 460.0 9.9 47.9 311.0 11.3
Corporate bond (public) 2,475.0 77.1 0.4 2,465.5 53.0 17.0 2,107.1 76.5
Capital increase -100.0 544.0 11.7
Primary Market Total 3,135.0 97.7 -9.6 3,469.5 74.5 43.5 2,418.1 87.8
Grand Total 3,208.1 100.0 -31.1 4,654.4 100.0 69.0 2,754.3 100.0
»16
LG Electronics Inc. The
43
rd Annual Report
Message from CFO
2001 2000 1999
Unit : Billion KRW, %
Source Balance Total % Change Balance Total % Change Balance Total %
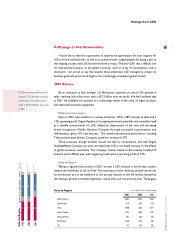
Financial institutions 267.7 29.8 -4.3 279.6 43.7 -42.0 482.2 74.4
Corporate-bonds 558.3 62.0 100.6 278.3 43.5 234.1 83.3 12.9
Stock, etc. 73.8 8.2 -10.7 82.6 12.9 0.0 82.6 12.7
Total 899.8 100.0 40.5 640.5 100.0 -1.2 648.1 100.0
2001 2000 1999
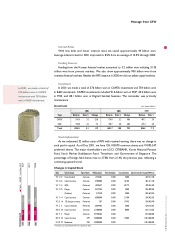
Funding (Domestic)
Funding / Unit : Trillion KRW
Funding (Overseas)
1999
2000
Overseas
2001
0
.
6
0
.
6
0
.
9
2
.
83
.
4
5
.
3
4
.
1
4
.
7
3
.
2
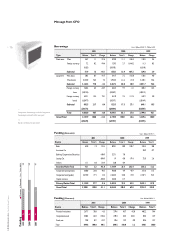
Unit : Billion KRW, %, Million USD
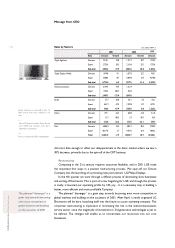
Type Balance Total % Change Balance Total % Change Balance Change
Short-term Won 44.7 1.1 -91.6 529.0 11.1 346.4 118.5 3.6
Foreign currency 7.2 0.2 -94.4 129.3 2.7 1,044.2 11.3 0.3
(U$5) (U$103) (U$10)
Sub-total 51.9 1.3 -92.1 658.3 13.9 407.2 129.8 3.9
Long-term Won loans 28.5 0.7 -91.7 341.7 7.2 155.8 133.6 4.0
Won bonds 3,135.0 76.3 7.2 2,925.5 61.6 21.0 2,418.1 72.6
Sub-total 3,163.5 77.0 -3.2 3,267.2 68.8 28.0 2,551.7 76.6
Foreign currency 260.4 6.3 -43.7 462.5 9.7 -4.1 482.2 14.5
loans (U$196) (U$367) (U$412)
Foreign currency 632.1 15.4 75.1 361.0 7.6 117.6 165.9 5.0
bonds (U$477) (U$317) (U$169)
Sub-total 892.5 21.7 8.4 823.5 17.3 27.1 648.1 19.5
(U$673) (U$684) (U$581)
Total 4,056.0 98.7 -0.8 4,090.7 86.1 27.8 3,199.8 96.1
Grand Total 4,107.9 100.0 -13.5 4,749.0 100.0 42.6 3,329.6 100.0
(U$678) (U$787) (U$591)
2001 2000 1999
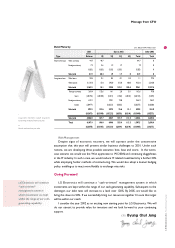
Borrowings
*
Long-term borrowings include long-term
borrowings matured within one year
**
Bonds are based on par value