Kia 2014 Annual Report Download - page 61
Download and view the complete annual report
Please find page 61 of the 2014 Kia annual report below. You can navigate through the pages in the report by either clicking on the pages listed below, or by using the keyword search tool below to find specific information within the annual report.-
 1
1 -
2
-
3
-
4
-
5
-
6
-
7
-
8
-
9
-
10
-
11
-
12
-
13
-
14
-
15
-
16
-
17
-
18
-
19
-
20
-
21
-
22
-
23
-
24
-
25
-
26
-
27
-
28
-
29
-
30
-
31
-
32
-
33
-
34
-
35
-
36
-
37
-
38
-
39
-
40
-
41
-
42
-
43
-
44
-
45
-
46
-
47
-
48
-
49
-
50
-
 51
51 -
 52
52 -
 53
53 -
 54
54 -
 55
55 -
 56
56 -
 57
57 -
 58
58 -
 59
59 -
 60
60 -
 61
61 -
 62
62 -
 63
63 -
 64
64 -
 65
65 -
 66
66 -
 67
67 -
 68
68
 |
 |

December 31, 2014 and 2013
Notes to the Consolidated
Financial Statements
KIA MOTORS CORPORATION AND SUBSIDIARIES
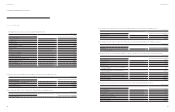
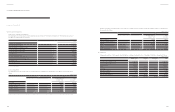
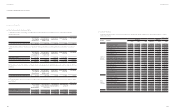
(iii) Financial instruments not measured at fair value, but presented as fair value
Financial instruments recognized by amortized cost, but presented as fair value classied by fair value hierarchy as of December 31, 2014 are
summarized as follows:
Level 1
Level 2 Level 3
Total
Bonds and borrowings ₩ - - 4,681,337 4,681,337
The Company has not disclosed the fair values for nancial instruments, because their carrying amounts are a reasonable approximation of fair
values.
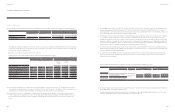
The valuation techniques and the signicant unobservable inputs used in measuring Level 3 fair values as of December 31, 2014 are summarized
as follows:
Fair value
Valuation
methods
Inputs
Signicant
unobservable
input
Bonds and borrowings ₩ 4,681,337 DCF model Discount rate Discount rate
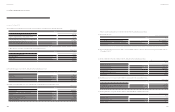
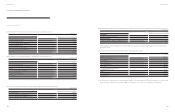
(f) Income and expense by nancial instruments category for the years ended December 31, 2014 and 2013 are summarized as follows:
2014 2013
Finance
income
Finance
costs
Other
comprehensive
income
Finance
income
Finance
costs
Other
comprehensive
income
Loans and receivables ₩ 231,121 52,843 - 206,961 25,078 -
Financial asset at fair value through prot or loss 56 - - - - -
Available-for- sale nancial assets 15,831 557 45,954 223,371 15,356 (143,399)
Held-to-maturity investments - - - 901 196 -
Liabilities recognized by amortized cost 2,358 113,788 - 24,042 98,812 -
Derivative nancial instruments 1,448 2,157 - - - -
₩ 250,814 169,345 45,954 455,275 139,442 (143,399)
(KRW in millions)
(KRW in millions)
(KRW in millions)
The Company measured the fair value of nancial instruments as follows:
- The fair value of available-for-sale nancial assets traded within the market is measured at the closing bid price quoted at the end of the
reporting period.
- The fair value of the derivatives is the present value of the difference between contractual forward price and future forward price discounted
during the remaining period of the contract, from present to contractual maturity.
Except for the nancial assets and liabilities above, the fair value of current receivables is close to their carrying amounts. In addition, the fair
value of other nancial instruments is determined as the present value of estimated future cash ows discounted at the current market interest
rate. As of December 31, 2014, there isn’t any signicant business climate and economic environment changes affecting the fair value of
nancial assets and liabilities.
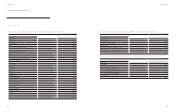
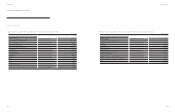
(ii) Fair value hierarchy
Fair value measurement classied by fair value hierarchy as of December 31, 2014 are summarized as follows:
Level 1
Level 2 Level 3
Total
Financial asset at fair value through prot or loss:
Financial asset at fair value through prot or loss ₩ - 200,056 - 200,056
Available-for-sale nancial assets:
Marketable securities 917,322 832,017 - 917,322
Financial derivatives assets:
Currency swap (risk hedge) - 1,448 - 1,448
Financial derivatives assets:
Currency swap (risk hedge) - 2,157 -2,157
(*)There were no signicant transfers between levels 1, 2, and 3.
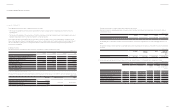
The valuation techniques and the unobservable inputs used in measuring Level 2 fair values as of December 31, 2014 are summarized as follows:
Fair value
Valuation methods Inputs
Financial assets at fair value through prot or loss ₩ 200,056
DCF model Discount rate(*)
Hedging derivative nancial assets 1,448
Hedging derivative nancial liabilities 2,157
(*)The expected net cash ows are discounted using a risk-adjusted discount rate based on government bonds
(KRW in millions)
(KRW in millions)
118 119
Annual Report 2014Financial Review