Kia 2014 Annual Report Download - page 47
Download and view the complete annual report
Please find page 47 of the 2014 Kia annual report below. You can navigate through the pages in the report by either clicking on the pages listed below, or by using the keyword search tool below to find specific information within the annual report.-
 1
1 -
2
-
3
-
4
-
5
-
6
-
7
-
8
-
9
-
10
-
11
-
12
-
13
-
14
-
15
-
16
-
17
-
18
-
19
-
20
-
21
-
22
-
23
-
24
-
25
-
26
-
27
-
28
-
29
-
30
-
31
-
32
-
33
-
34
-
35
-
36
-
 37
37 -
 38
38 -
 39
39 -
 40
40 -
 41
41 -
 42
42 -
 43
43 -
 44
44 -
 45
45 -
 46
46 -
 47
47 -
 48
48 -
 49
49 -
 50
50 -
 51
51 -
 52
52 -
 53
53 -
 54
54 -
 55
55 -
 56
56 -
 57
57 -
58
-
59
-
60
-
61
-
62
-
63
-
64
-
65
-
66
-
67
-
68
 |
 |
December 31, 2014 and 2013
Notes to the Consolidated
Financial Statements
KIA MOTORS CORPORATION AND SUBSIDIARIES
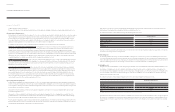
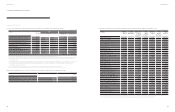
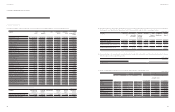
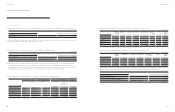
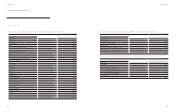
(g) Financial information of signicant associates and joint ventures reconciled from the proportionate share in investees’ net assets to the balance in
the Company’s consolidated nancial statements as of and for the year ended December 31, 2014 is summarized as follows:
Company Net assets
(*)
The Company’s
ownership
percentage
Based on
Company’s
ownership
percentage
Goodwill Intra-
Company
transaction
Acquisition
Adjustments
Ending
balance
Hyundai Mobis Co., Ltd. ₩ 22,192,766 16.88% 3,745,097 29,519 (3,894) - 3,770,722
Hyundai Steel Company 13,617,929 19.78% 2,693,114 - (43,222) - 2,649,892
Hyundai Engineering & Construction Co., Ltd. 5,443,847 5.23% 284,849 284,338 - 213,534 782,721
Dongfeng Yueda Kia Motors Co., Ltd. 1,938,351 50.00% 969,176 - (10,776) - 958,400
(*) Excluded proportionate share of non-controlling interests in net assets of associates and joint ventures.
(h) Unrecognized share of loss in investment in associate and joint ventures due to discontinuing the use of the equity method as of and for the year
ended December 31, 2014 is summarized as follows:
2014 Accumulated
Kia Tigers Co., Ltd
₩ 254
921
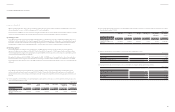
9. Property, Plant and Equipment
(a) Details of property, plant and equipment as of December 31, 2014 and 2013 are summarized as follows:
2014 2013
Acquisition
cost
Accumulated
depreciation and
impairment losses
Carrying
amount
Acquisition cost Accumulated
depreciation and
impairment losses
Carrying amount
Land ₩ 2,669,012 - 2,669,012 2,684,696
-
2,684,696
Buildings 2,824,763 (847,946) 1,976,817 2,630,937 (749,964) 1,880,973
Structures 598,966 (321,461) 277,505 576,239 (299,412) 276,827
Machinery and equipment 6,214,330 (3,033,159) 3,181,171 5,932,999 (2,746,757) 3,186,242
Dies, molds and tools 3,413,559 (2,601,292) 812,267 3,082,527 (2,353,705) 728,822
Vehicles 197,819 (69,075) 128,744 158,407 (54,581) 103,826
Other equipment 466,451 (294,486) 171,965 423,198 (248,764) 174,434
Construction-in-progress 896,836 - 896,836 741,185 - 741,185
₩ 17,281,736 (7,167,419) 10,114,317 16,230,188 (6,453,183) 9,777,005
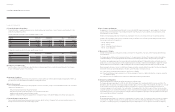
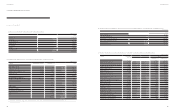
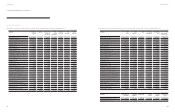
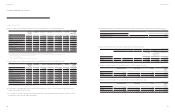
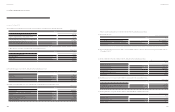
(f) Financial information of associates and joint ventures as of and for the year ended December 31, 2013 is summarized as follows:
Company Total
assets
Total
liabilities
Sales Operating
income
Net income
(loss)
Other
comprehensive
income
Hyundai Mobis Co., Ltd. ₩
34,430,309 14,237,123 34,198,594 2,924,404 3,396,421 3,338,291
Hyundai Steel Company
29,520,275 16,155,592 13,532,755 762,603 709,399 699,058
Hyundai Engineering & Construction Co.,Ltd.
14,733,212 9,530,137 13,938,287 792,870 569,644 467,293
Hyundai Powertech Co., Ltd.
2,084,031 1,165,303 3,273,053 154,029 93,526 98,060
Hyundai Card Co., Ltd.
11,520,878 9,154,730 2,527,511 219,956 163,210 169,868
Hyundai Dymos Inc.
1,457,200 881,109 1,604,118 52,358 87,153 82,749
EUKOR Car Carriers Inc.
2,754,268 1,515,899 2,594,605 264,134 258,005 242,977
Hyundai AMCO Co., Ltd.
1,772,984 1,121,940 3,407,082 254,341 138,136 127,238
Hyundai Partecs Co., Ltd.
134,817 68,443 48,256 3,924 2,012 2,012
Hyundai Autoever Systems Co., Ltd.
482,880 260,073 1,033,866 54,255 45,867 44,827
Donghee Auto Co., Ltd.
151,060 109,590 203,741 7,160 5,100 5,100
TRW Steering Co., Ltd.
29,698 25,823 78,526 (4,661) (4,181) (4,172)
Kia Tigers Co., Ltd
4,306 4,977 30,627 (1,035) (96) (96)
Hyundai NGV Co., Ltd.
14,539 7,762 26,820 808 698 698
Haevichi Resort Co., Ltd.
329,981 272,576 65,025 9,361 9,962 9,962
Hyundai Autron Co., Ltd
198,875 102,911 644,339 1,736 3,643 4,064
Beijing Dymos Transmission Co., Ltd.
374,412 133,079 417,225 43,752 35,313 35,313
China Millennium Corporations
91,922 18,413 27,852 10,640 8,588 8,588
Hyundai Motor Company China Ltd.
475,892 149,745 1,830,188 68,951 66,577 66,577
Hyundai Powertech (Shangdong) Co., Ltd.
719,311 537,456 1,287,527 72,132 54,362 54,362
Dongfeng Yueda Kia Motors Co., Ltd. (*)
4,345,805 2,551,706 9,041,489 1,010,464 759,553 759,553
Hyundai Motor Manufacturing Russia LLC
1,293,992 615,614 2,750,925 282,040 209,710 209,710
Innocean Worldwide Americas, LLC
200,297 176,118 225,905 14,676 14,781 14,781
Hyundai Information System North America
31,849 21,530 202,494 3,379 3,447 3,447
Sewon America, Inc.
275,897 254,367 388,223 3,696 (585) (585)
Hyundai Capital Services UK Ltd. (*)
1,215,030 1,139,443 54,145 14,544 11,100 11,100
(*) Additional nancial information of joint ventures is summarized as follows:
Company Cash and cash
equivalents
Financial
liabilities
Depreciation Interest
income
Interest
expense
Income tax
expense
Dongfeng Yueda Kia Motors Co., Ltd. ₩ 291,366 442,205 98,951 7,845 5,457 248,787
Hyundai Capital Services UK Ltd. 24,212 1,131,374 - 105 - 3,421
(KRW in millions)
(KRW in millions)
(KRW in millions)
(KRW in millions)
(KRW in millions)
90 91
Annual Report 2014Financial Review