Kia 2014 Annual Report Download - page 54
Download and view the complete annual report
Please find page 54 of the 2014 Kia annual report below. You can navigate through the pages in the report by either clicking on the pages listed below, or by using the keyword search tool below to find specific information within the annual report.-
 1
1 -
2
-
3
-
4
-
5
-
6
-
7
-
8
-
9
-
10
-
11
-
12
-
13
-
14
-
15
-
16
-
17
-
18
-
19
-
20
-
21
-
22
-
23
-
24
-
25
-
26
-
27
-
28
-
29
-
30
-
31
-
32
-
33
-
34
-
35
-
36
-
37
-
38
-
39
-
40
-
41
-
42
-
43
-
 44
44 -
 45
45 -
 46
46 -
 47
47 -
 48
48 -
 49
49 -
 50
50 -
 51
51 -
 52
52 -
 53
53 -
 54
54 -
 55
55 -
 56
56 -
 57
57 -
 58
58 -
 59
59 -
 60
60 -
 61
61 -
 62
62 -
 63
63 -
 64
64 -
65
-
66
-
67
-
68
 |
 |

December 31, 2014 and 2013
Notes to the Consolidated
Financial Statements
KIA MOTORS CORPORATION AND SUBSIDIARIES
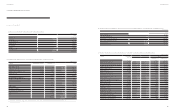
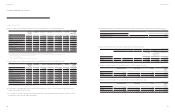
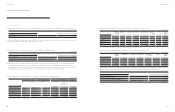
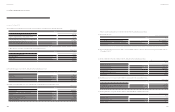
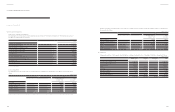
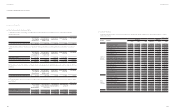
24. Selling, General and Administrative Expense
Details of selling, general and administrative expenses for the years ended December 31, 2014 and 2013 are as follows:
2014 2013
Selling expenses:
Advertising
₩ 1,088,821
1,227,916
Sales promotion
737,126
794,527
Warranty expenses
997,232
1,050,494
Freight
296,622
299,982
Overseas marketing and export expenses
1,066,488
1,038,792
4,186,289
4,411,711
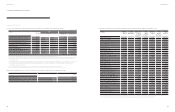
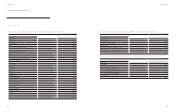
General and administrative expenses:
Salaries
687,239
667,469
Bonus
303,421
297,713
Retirement and severance benets cost
72,075
71,324
Accrual for other long-term employee benets
8,087
6,475
Other employee benets
159,542
153,096
Travel
43,131
41,741
Communications
18,020
16,576
Utilities
16,730
16,707
Taxes and dues
21,888
22,972
Rent
59,633
58,168
Depreciation
83,329
84,289
Amortization
23,496
20,266
Bad debt expenses
(8,010)
86
Repairs and maintenance
22,339
24,486
Insurance premium
10,386
11,160
Entertainment expense
5,946
5,363
Maintenance fee for vehicles
27,214
29,305
Supplies and stationery
11,088
10,706
Information fees
2,384
2,327
Education and training
30,378
32,144
Commissions and fees
319,913
321,820
Test expenses
623,603
563,270
Others
42,264
39,682
2,584,096
2,497,145
₩ 6,770,385
6,908,856
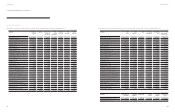
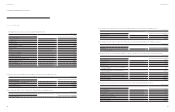
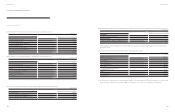
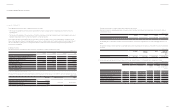
25. Finance Income and Finance Costs
Details of nance income and nance costs for the years ended December 31, 2014 and 2013 are summarized as follows:
2014 2013
Finance income
Interest income
₩ 206,582
172,623
Gain on foreign currency transaction
26,652
35,239
Gain on foreign currency translation
2,358
24,042
Dividends income
13,713
11,049
Gain on sale of available-for-sale nancial assets (*)
5
212,322
Gain on derivatives
1,448
-
Gain on nancial asset at fair value through prot or loss
56
-
₩ 250,814
455,275
(*) The Company recognized gain on disposal of available-for-sale nancial assets amounting ₩ 212,322 million (Accumulative other comprehensive income) of Hyundai Hysco Co., Ltd in
connection to the merger of Hyundai Steel Company and the Cold-Rolled Coil Division spun off from Hyundai Hysco Co., Ltd for the year ended December 31, 2013.
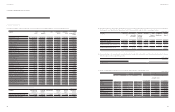
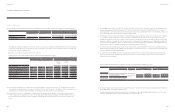
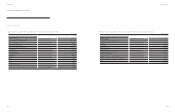
2014 2013
Finance costs
Interest expense
₩ 57,240
89,673
Loss on foreign currency transaction
62,223
25,682
Loss on foreign currency translation
47,168
8,535
Loss on sale of available-for-sale nancial assets
557
1
Impairment loss of available-for-sale nancial assets
-
15,355
Loss on sale of held-to-maturity investments
-
196
Loss on derivatives 2,157
-
₩ 169,345
139,442
(KRW in millions) (KRW in millions)
(KRW in millions)
104 105
Annual Report 2014Financial Review