Kia 2014 Annual Report Download - page 60
Download and view the complete annual report
Please find page 60 of the 2014 Kia annual report below. You can navigate through the pages in the report by either clicking on the pages listed below, or by using the keyword search tool below to find specific information within the annual report.-
 1
1 -
2
-
3
-
4
-
5
-
6
-
7
-
8
-
9
-
10
-
11
-
12
-
13
-
14
-
15
-
16
-
17
-
18
-
19
-
20
-
21
-
22
-
23
-
24
-
25
-
26
-
27
-
28
-
29
-
30
-
31
-
32
-
33
-
34
-
35
-
36
-
37
-
38
-
39
-
40
-
41
-
42
-
43
-
44
-
45
-
46
-
47
-
48
-
49
-
 50
50 -
 51
51 -
 52
52 -
 53
53 -
 54
54 -
 55
55 -
 56
56 -
 57
57 -
 58
58 -
 59
59 -
 60
60 -
 61
61 -
 62
62 -
 63
63 -
 64
64 -
 65
65 -
 66
66 -
 67
67 -
 68
68
 |
 |
December 31, 2014 and 2013
Notes to the Consolidated
Financial Statements
KIA MOTORS CORPORATION AND SUBSIDIARIES
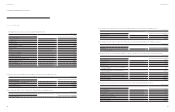
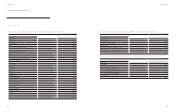
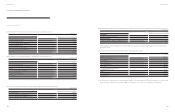
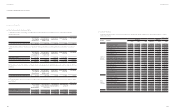
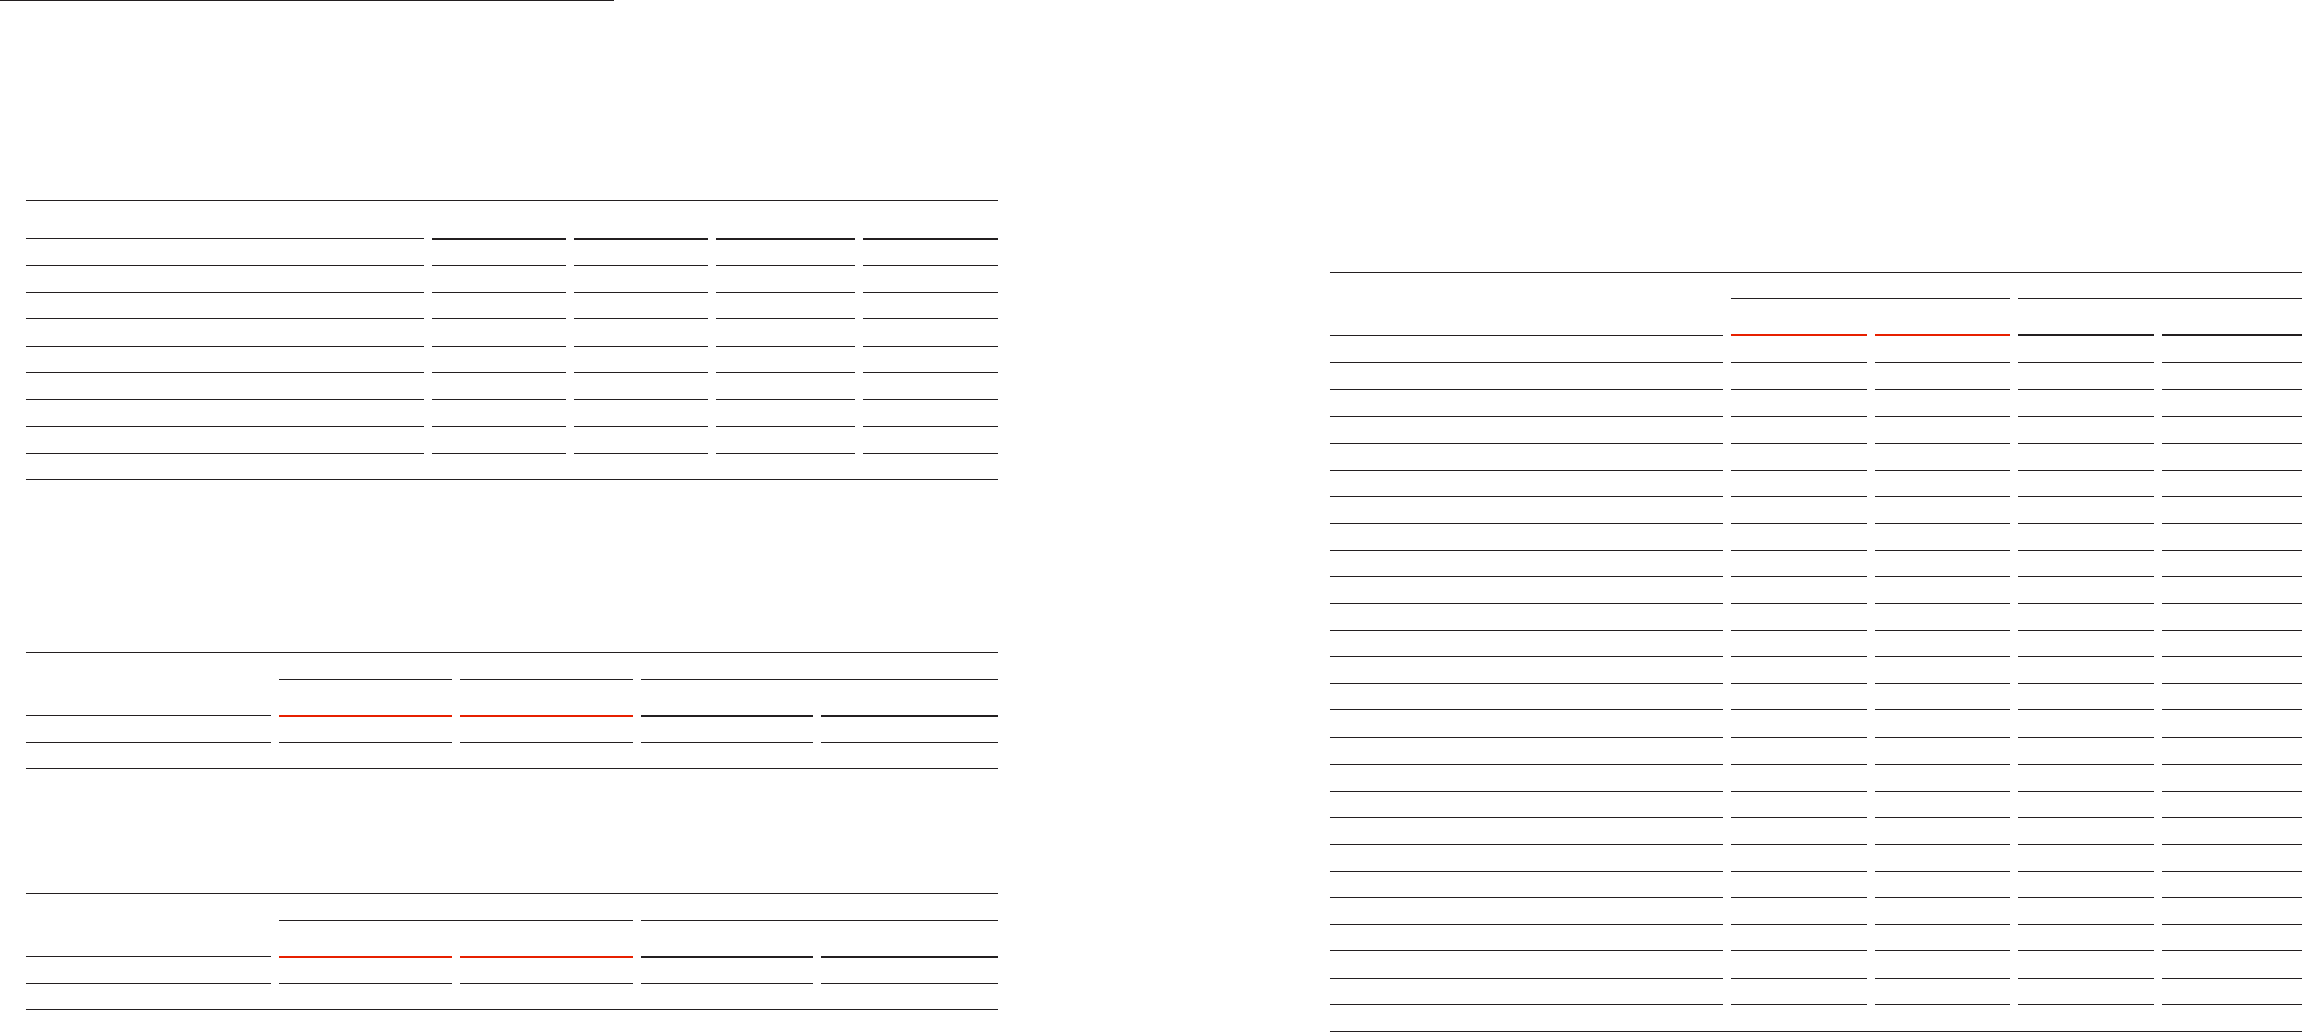
(e) Fair value
(i) Fair value and carrying amount
Details of fair value and carrying amount of nancial assets and liabilities by category as of December 31, 2014 and 2013 are summarized as
follows:
2014 2013
Carrying amount Fair value Carrying amount Fair value
Financial instruments at fair value through prot or loss:
Financial instruments at fair value through prot or loss
₩ 200,056 200,056 - -
Loans and receivables:
Cash and cash equivalents
₩ 2,478,470 2,478,470 2,311,264 2,311,264
Short-term nancial instruments
3,458,889 3,458,889 4,035,379 4,035,379
Account and notes receivable – trade
2,419,265 2,419,265 2,072,818 2,072,818
Account and note receivable – other
514,366 514,366 468,210 468,210
Long-term account and notes receivable – trade
3,836 3,836 1,662 1,662
Other nancial assets
456,330 456,330 640,517 640,517
₩ 9,331,156 9,331,156 9,529,850 9,529,850
Available-for-sale nancial assets:
Short-term available-for-sale nancial assets
1,176,362 1,176,362 8,000 8,000
Long-term available-for-sale nancial assets
1,245,287 1,245,287 1,237,107 1,237,107
₩ 2,421,649 2,421,649 1,245,107 1,245,107
Financial derivatives assets:
Currency swap (risk hedge)
₩ 1,448 1,448 - -
Liabilities recognized by amortized cost:
Accounts and notes payable - trade
₩ 5,888,191 5,888,191 5,192,589 5,192,589
Accounts and notes payable - other
1,959,339 1,959,339 1,763,692 1,763,692
Bonds
1,112,073 1,133,989 1,508,184 1,450,395
Borrowings
3,579,120 3,547,348 1,813,586 1,839,613
Financial lease liabilities
9,853 9,853 17,382 17,382
Other nancial liabilities
1,424,263 1,424,263 1,206,895 1,206,895
₩ 13,972,839 13,962,983 11,502,328 11,470,566
Financial derivatives liabilities:
Currency swap (risk hedge)
₩ 2,157 2,157 - -
(KRW in millions)
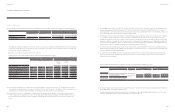
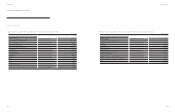
(ii) Aggregate maturities of the Company’s nancial liabilities, including estimated interest, as of December 31, 2013 are summarized as follows:
Within 1 year
1~5 years Over 5 years
Total
Accounts and notes payable - trade ₩ 5,192,589 - - 5,192,589
Accounts and notes payable - other 1,763,692 - - 1,763,692
Accrued expenses 1,119,919 - - 1,119,919
Bonds 471,904 1,140,048 - 1,611,952
Borrowings 1,265,176 675,399 23,717 1,964,292
Financial lease liabilities 6,567 16,266 - 22,833
Other current liabilities 2,182 - - 2,182
Other non-current liabilities - 86,143 -86,143
₩ 9,822,029 1,917,856 23,717 11,763,602
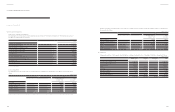
(c) Foreign exchange risk
The Company’s capital and income (loss) would have been increased or decreased, if the foreign exchange rate against USD and EUR were
higher. The Company assumes that interest rate uctuates 10% at year ended period. Also, the Company assumes that others variables such as
interest rate are not changed by sensitive analysis. The Company analyzed by the same method as used for last period and details for the effect
on income before taxes are summarized as follows:
2014 2013
10% Up 10% Down 10% Up 10% Down
USD
₩ (186,042) 186,042
(131,830) 131,830
EUR
(14,403) 14,403 16,016 (16,016)
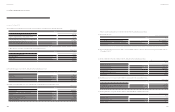
(d) Interest rate risk
Sensitivity analysis of interest expenses and interests income from changes of interests rate for the years ended December 31, 2014 and 2013 are
as summarized as follows:
2014 2013
10% Up 10% Down 10% Up 10% Down
Interest income
₩ 24,785 (24,785)
23,110 (23,110)
Interest expense
12,900 (12,900) 10,762 (10,762)
(KRW in millions)
(KRW in millions)
(KRW in millions)
116 117
Annual Report 2014Financial Review