Kia 2014 Annual Report Download - page 44
Download and view the complete annual report
Please find page 44 of the 2014 Kia annual report below. You can navigate through the pages in the report by either clicking on the pages listed below, or by using the keyword search tool below to find specific information within the annual report.-
 1
1 -
2
-
3
-
4
-
5
-
6
-
7
-
8
-
9
-
10
-
11
-
12
-
13
-
14
-
15
-
16
-
17
-
18
-
19
-
20
-
21
-
22
-
23
-
24
-
25
-
26
-
27
-
28
-
29
-
30
-
31
-
32
-
33
-
 34
34 -
 35
35 -
 36
36 -
 37
37 -
 38
38 -
 39
39 -
 40
40 -
 41
41 -
 42
42 -
 43
43 -
 44
44 -
 45
45 -
 46
46 -
 47
47 -
 48
48 -
 49
49 -
 50
50 -
 51
51 -
 52
52 -
 53
53 -
 54
54 -
55
-
56
-
57
-
58
-
59
-
60
-
61
-
62
-
63
-
64
-
65
-
66
-
67
-
68
 |
 |
December 31, 2014 and 2013
Notes to the Consolidated
Financial Statements
KIA MOTORS CORPORATION AND SUBSIDIARIES
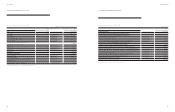
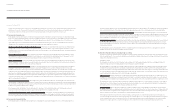
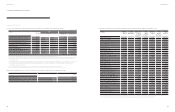
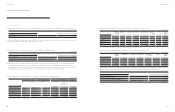
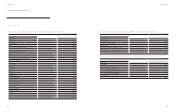
6. Inventories
Inventories as of December 31, 2014 and 2013 are summarized as follows:
2014 2013
Finished goods ₩ 4,733,908 3,099,839
Merchandise 45,932 42,715
Semi-nished goods 319,761 445,778
Work-in-process 196,849 196,921
Raw materials 391,060 332,201
Supplies 152,752 145,397
Materials-in-transit 240,320 68,516
₩ 6,080,582 4,331,367
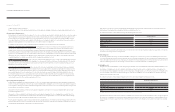
7. Available-for-sale Financial Assets
(a) Available-for-sale nancial assets as of December 31, 2014 and 2013 are summarized as follows:
Company Percentage of ownership Acquisition cost 2014 2013
Marketable securities
Hyundai WIA Corporation 13.44% ₩ 237,510 643,105 694,260
Hyundai Hysco Co., Ltd. 15.65% 63,794 259,568 148,172
HMC Investment Securities Co., Ltd. 4.90% 29,574 14,600 10,584
SeAH Besteel Corp. 0.00% 20 49 45
330,898 917,322 853,061
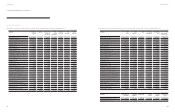
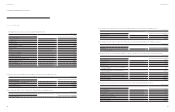
Non-marketable securities(*1)
WIA Automotive Engine (Shang-dong) Company 18.00% 47,332 47,332 47,332
Hyundai Capital America(*2) - - -316,590
Other 20,313 20,313 19,494
67,645 67,645 383,416
Debt securities
Subordinate securities - -8,000
Industrial nance bond and other 891,148 891,148 -
Bond trust and other 544,906 544,906 -
Other 628 628 630
1,436,682 1,436,682 8,630
₩ 1,835,225 2,421,649 1,245,107
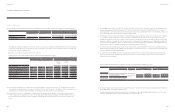
(*1) Investments in equity instruments that do not have a quoted market price in an active market, and whose fair value cannot be reliably measured are measured at cost.
(*2) The Company was able to exercise signicant inuence on the entity by acquisition of shares in 2014, therefore reclassied the investment from available-for-sale nancial assets to investments in
associates and joint ventures.
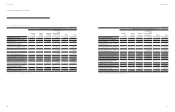
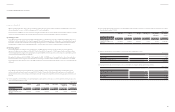
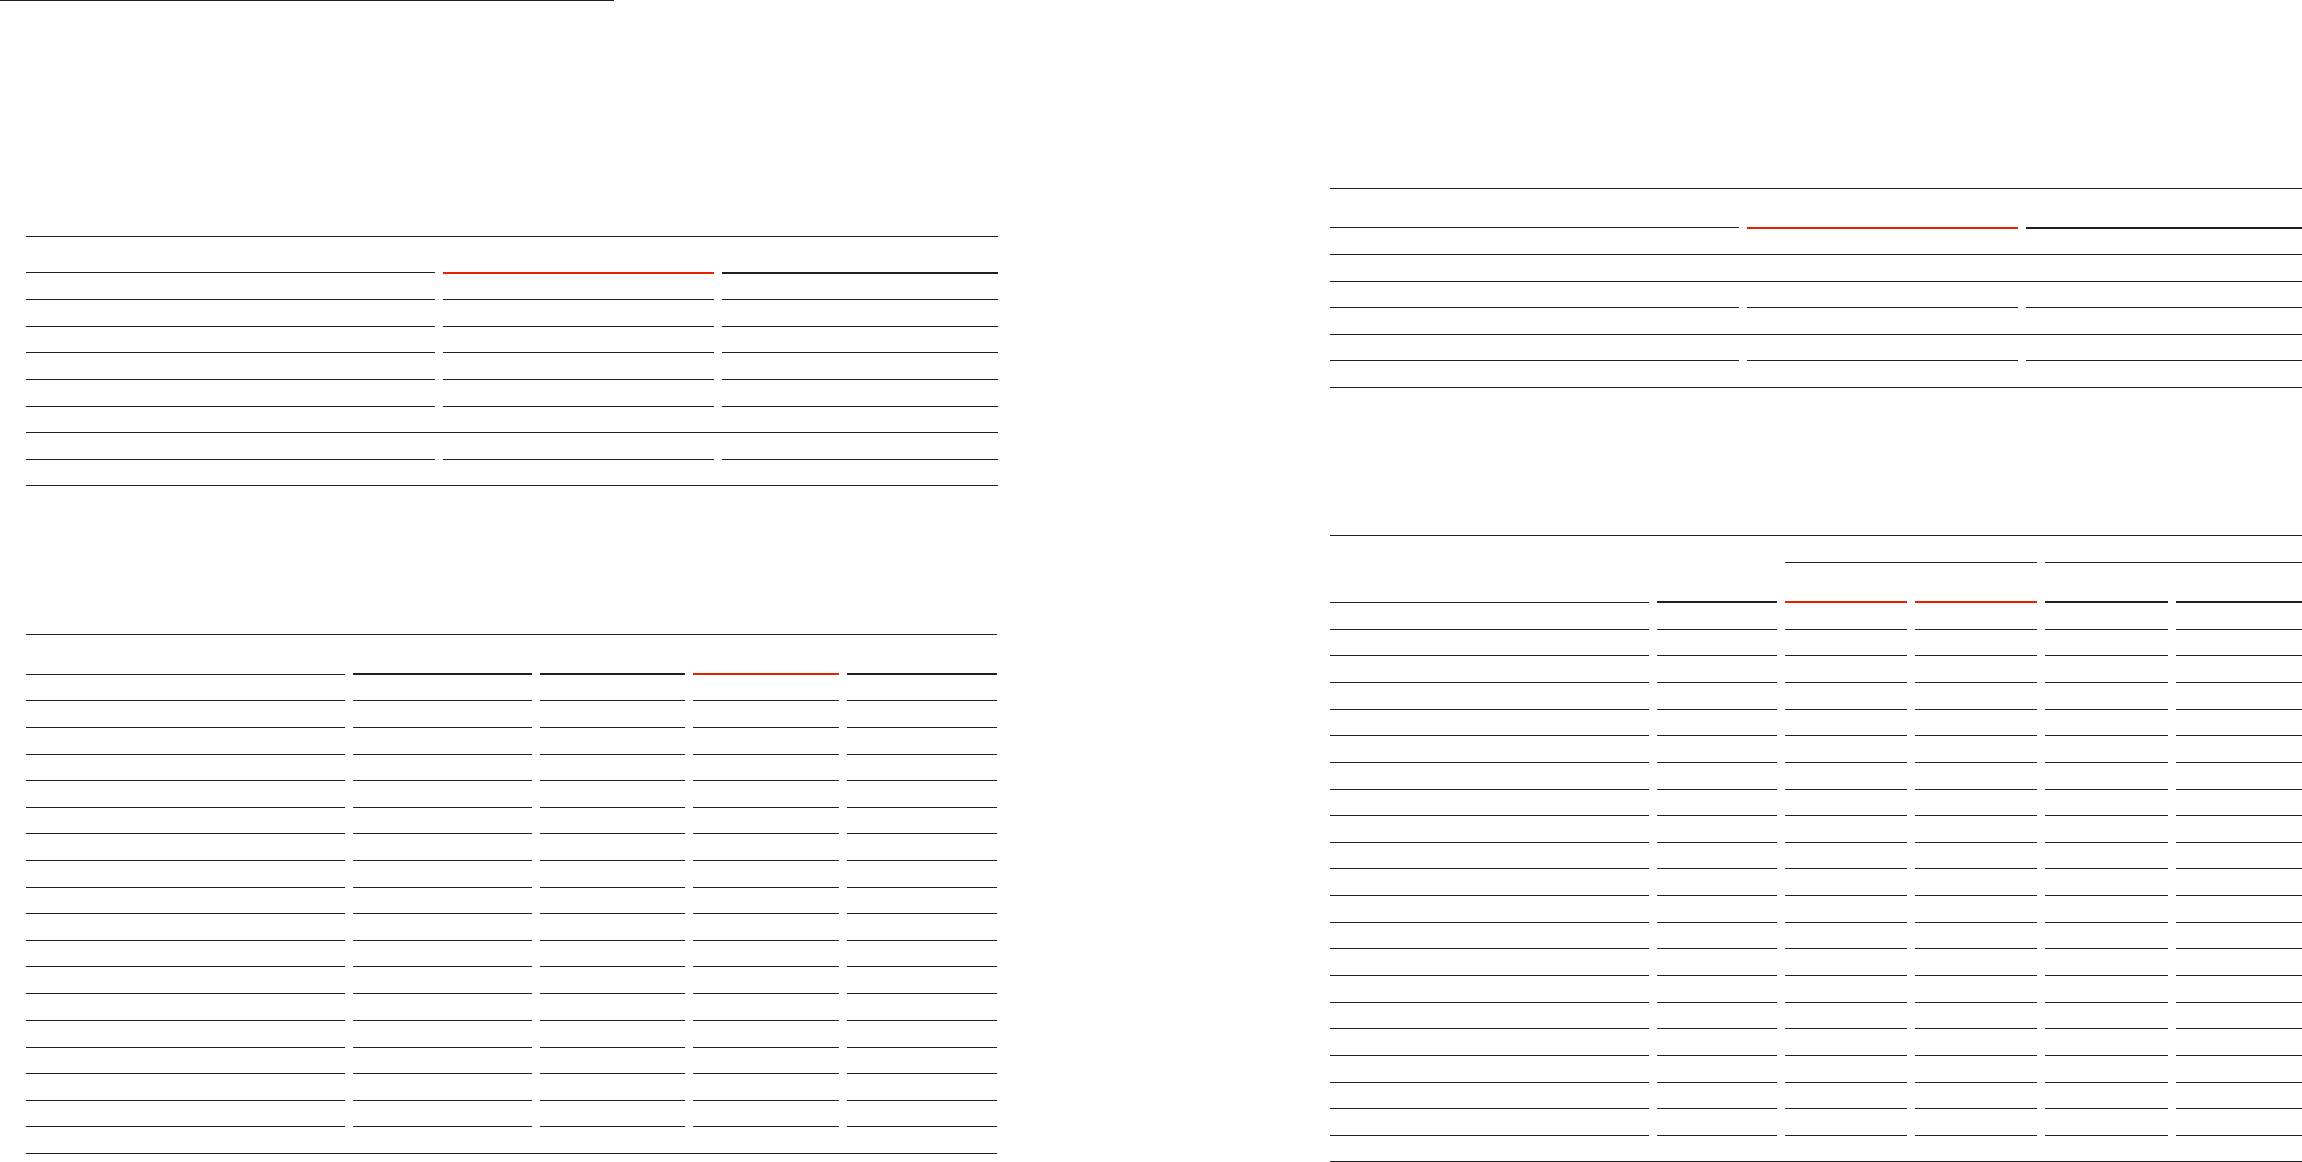
(b) Changes in fair value of available-for-sale nancial assets for the years ended December 31, 2014 and 2013 are summarized as follows:
2014 2013
Balance at January 1 ₩ 541,153 730,334
Changes in unrealized gain 60,625 7,786
Realized in prot or loss upon disposal -(196,967)
Balance at December 31 before taxes 601,778 541,153
Income tax effect (145,630) (130,959)
Balance at December 31 ₩ 456,148 410,194
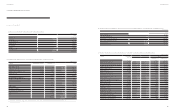
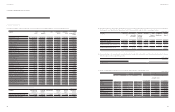
8. Investments in Associates and Joint Ventures
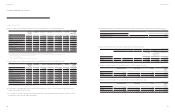
(a) Details of investments in associates and joint ventures as of December 31, 2014 and 2013 are summarized as follows:
Company Percentage of
ownership
2014 2013
Acquisition cost Carrying amount Acquisition cost Carrying amount
Hyundai Mobis Co., Ltd.(*1) 16.88% ₩ 215,012 3,770,722 215,012 3,288,988
Hyundai Steel Company (*1) 19.78% 618,000 2,649,892 618,000 2,566,364
Hyundai Engineering & Construction Co., Ltd.(*1) 5.23% 746,234 782,721 746,234 762,700
Hyundai Powertech Co., Ltd. 37.58% 172,576 386,175 172,576 344,798
Hyundai Card Co., Ltd.(*1) 11.48% 147,960 300,676 147,960 271,642
Hyundai Dymos Inc. 45.37% 89,438 278,619 89,438 261,013
EUKOR Car Carriers Inc.(*1) 8.00% 19,565 113,247 19,565 99,070
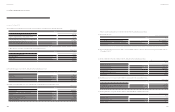
Hyundai AMCO Co., Ltd.(*4) - - - 10,067 129,764
Hyundai Engineering Co., Ltd.(*1,4) 9.35% 214,848 215,700 - -
Hyundai Partecs Co., Ltd. 31.00% 12,400 21,403 12,400 20,576
Hyundai Autoever Systems Co., Ltd.(*1,7) 19.37% 1,000 53,786 1,000 44,487
Donghee Auto Co., Ltd. 35.10% 10,530 16,178 10,530 14,556
TRW Steering Co., Ltd. 29.00% 8,952 770 8,952 1,124
Kia Tigers Co., Ltd.(*2) 100.00% 20,300 - 20,300 -
Hyundai NGV Co., Ltd. 24.39% 250 2,146 250 1,653
Haevichi Resort Co., Ltd. 40.00% 8,520 21,656 8,520 22,962
Hyundai Autron Co., Ltd. 20.00% 20,116 19,579 20,116 19,212
Beijing Dymos Transmission Co., Ltd. 24.08% 22,790 57,455 22,790 58,113
China Millennium Corporations 30.30% 27,185 26,006 27,185 21,852
Hyundai Motor Company China Ltd. 30.00% 19,671 94,624 19,671 93,526
Yanji Kia Motors A/S and Repair(*2) 100.00% 1,792 1,792 1,792 1,792
(KRW in millions)
(KRW in millions)
(KRW in millions)
(KRW in millions)
84 85
Annual Report 2014Financial Review