Kia 2014 Annual Report Download - page 43
Download and view the complete annual report
Please find page 43 of the 2014 Kia annual report below. You can navigate through the pages in the report by either clicking on the pages listed below, or by using the keyword search tool below to find specific information within the annual report.-
 1
1 -
2
-
3
-
4
-
5
-
6
-
7
-
8
-
9
-
10
-
11
-
12
-
13
-
14
-
15
-
16
-
17
-
18
-
19
-
20
-
21
-
22
-
23
-
24
-
25
-
26
-
27
-
28
-
29
-
30
-
31
-
32
-
 33
33 -
 34
34 -
 35
35 -
 36
36 -
 37
37 -
 38
38 -
 39
39 -
 40
40 -
 41
41 -
 42
42 -
 43
43 -
 44
44 -
 45
45 -
 46
46 -
 47
47 -
 48
48 -
 49
49 -
 50
50 -
 51
51 -
 52
52 -
 53
53 -
54
-
55
-
56
-
57
-
58
-
59
-
60
-
61
-
62
-
63
-
64
-
65
-
66
-
67
-
68
 |
 |

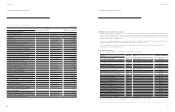
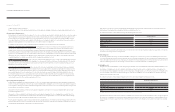
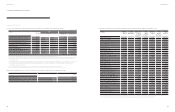
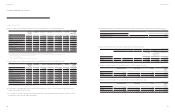
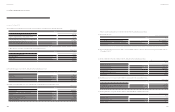
(b) The following tables provide information of sales by geographic locations based on the location of customers and non-current assets as of and for
the year ended December 31, 2013:
Domestic North
America
Europe Other region Consolidation
adjustment
Consolidation
amount
External sales ₩ 17,325,792 17,090,431 12,360,058 821,616 - 47,597,897
Property, plant and
equipment, intangible assets
and other
9,079,840 1,174,659 1,229,526 5,269 53,704 11,542,998
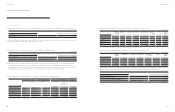
5. Cash, Cash Equivalents and Restricted Financial Instrument
(a) Cash and cash equivalents as of December 31, 2014 and 2013 are summarized as follows:
2014 2013
Cash on hand ₩ 299 477
Deposits with nancial institutions 2,478,171 2,310,787
₩ 2,478,470 2,311,264
(b) Financial instruments which are restricted in use for as of December 31, 2014 and 2013 are summarized as follows:
2014 2013
Win-Win cooperation deposits ₩ 31,000 27,000
Guarantee deposits 10 10
Green mold fund 20,000 20,000
Other deposits 23,143 31,954
₩ 74,153 78,964
December 31, 2014 and 2013
Notes to the Consolidated
Financial Statements
KIA MOTORS CORPORATION AND SUBSIDIARIES
(KRW in millions)
(KRW in millions)
(KRW in millions)
(KRW in millions)
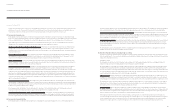
liabilities and deferred tax assets reects the tax consequences that would follow from the manner in which the Company expects, at the end of
the reporting period to recover or settle the carrying amount of its assets and liabilities.
Deferred tax assets and liabilities are offset only if there is a legally enforceable right to offset the related current tax liabilities and assets, and they
relate to income taxes levied by the same tax authority and they intend to settle current tax liabilities and assets on a net basis.
(x) Earnings per share
The Company presents basic and diluted earnings per share (EPS) data for its ordinary shares. Basic EPS is calculated by dividing the prot or loss
attributable to ordinary shareholders of the Parent Company by the weighted average number of ordinary shares outstanding during the period,
adjusted for own shares held. Diluted EPS is determined by adjusting the prot or loss attributable to ordinary shareholders and the weighted
average number of ordinary shares outstanding, adjusted for own shares held, for the effects of all potential dilutive ordinary shares.
(y) Operating segments
An operating segment is a component of the Company that: 1) engages in business activities from which it may earn revenues and incur
expenses, including revenues and expenses that relate to transactions with other components of the Company, 2) whose operating results are
reviewed regularly by the Company’s chief operating decision maker (’CODM’) in order to allocate resources and assess its performance, and 3)
for which discrete nancial information is available.
Management has determined that the CODM of the Company is the CEO. The CODM does not receive and therefore does not review discrete
nancial information for any component of the Company. Consequently, no operating segment information is included in these consolidated
nancial statements. Entity-wide disclosures of geographic and product revenue information are provided in note 4 to the consolidated nancial
statements.
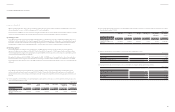
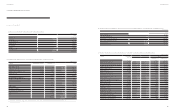
4. Geographic and Other Information
The Company is engaged in manufacturing and sales of vehicles and parts, leasing of vehicles and rendering vehicle maintenance services.
Leasing income and maintenance services are insignicant to total sales. Revenue information by products and services is not available and
management believes the cost to develop such information would be excessive. Consequently revenue amounts by products and services is not
disclosed.
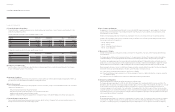
(a) The following tables provide information of sales by geographic locations based on the location of customers and non-current assets as of and
for the year ended December 31, 2014:
Domestic North
America
Europe Other region Consolidation
adjustment
Consolidation
amount
External sales ₩ 17,695,609 16,865,983 11,892,172 643,285 - 47,097,049
Property, plant and
equipment, intangible assets
and other
9,650,614 1,285,600 1,059,052 4,544 54,584 12,054,394
82 83
Annual Report 2014Financial Review