Kia 2014 Annual Report Download - page 3
Download and view the complete annual report
Please find page 3 of the 2014 Kia annual report below. You can navigate through the pages in the report by either clicking on the pages listed below, or by using the keyword search tool below to find specific information within the annual report.-
 1
1 -
 2
2 -
 3
3 -
 4
4 -
 5
5 -
 6
6 -
 7
7 -
 8
8 -
 9
9 -
 10
10 -
 11
11 -
 12
12 -
 13
13 -
 14
14 -
15
-
16
-
17
-
18
-
19
-
20
-
21
-
22
-
23
-
24
-
25
-
26
-
27
-
28
-
29
-
30
-
31
-
32
-
33
-
34
-
35
-
36
-
37
-
38
-
39
-
40
-
41
-
42
-
43
-
44
-
45
-
46
-
47
-
48
-
49
-
50
-
51
-
52
-
53
-
54
-
55
-
56
-
57
-
58
-
59
-
60
-
61
-
62
-
63
-
64
-
65
-
66
-
67
-
68
 |
 |
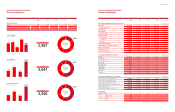
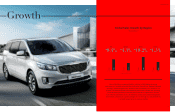
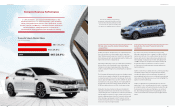
Business Highlights
2014 2013 2012 2011 2010
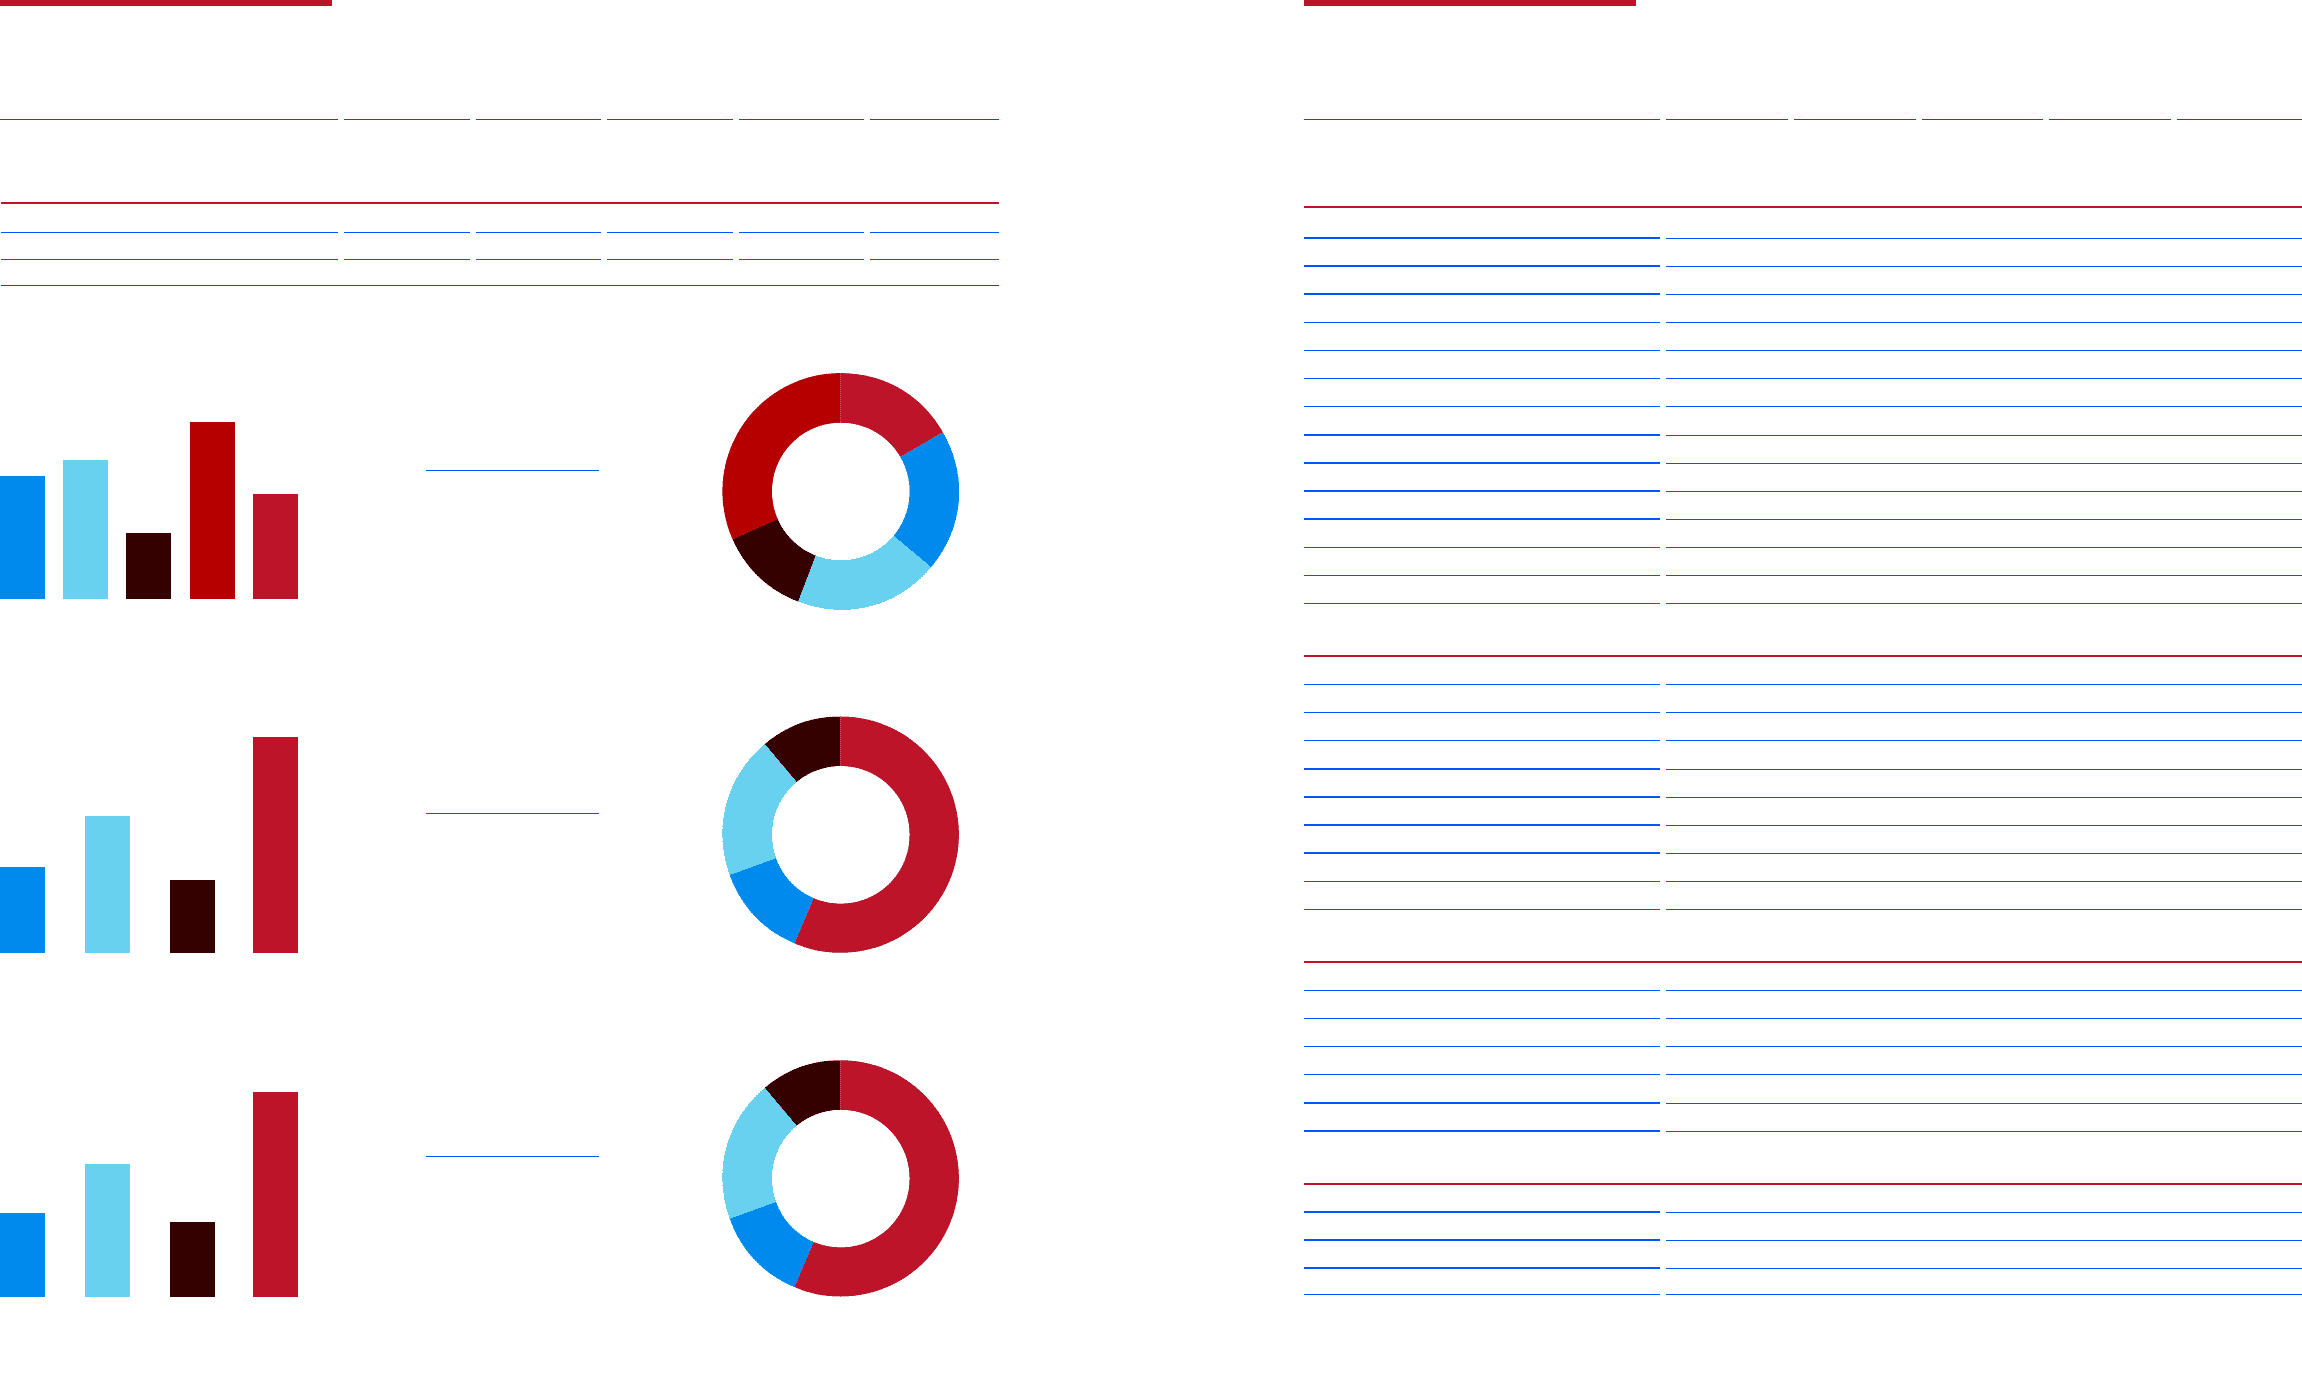
Global Retail Sales
Total 2,907 2,746 2,709 2,478 2,088
Korea 465 458 481 492 483
Overseas 2,442 2,289 2,228 1,986 1,605
(Unit: thousand vehicles)
16.0
22.2
12.1
29.7
Portion
(%) 20.0
56.1
12.0
21.2
10.7
Portion
(%)
56.2
12.1
21.1
10.6
Portion
(%)
2,907
Total
3,041
Total
3,050
Total
Sales by Region
(Unit: thousand vehicles)
Sales by Plant
(Unit: thousand vehicles)
Production by Plant
(Unit: thousand vehicles)
862
Rest of World
354
Europe
646
China
580
US
465
Korea
1,706
323
366
Korea
Slovakia
646
China
US
1,713
324
644
369
Korea
Slovakia
China
US
* Europe = EU+EFTA countries
Financial Highlights
2014 2013 2012 2011 2010
Consolidated Statement of Financial Position*
Total Assets 41,044,202 36,182,040 32,398,314 30,255,179 26,275,144
Cash Items (Liquidity) 7,373,413 6,346,643 4,270,539 3,934,169 2,914,146
Current Assets 16,655,401 13,472,386 11,139,430 11,075,187 9,763,671
Total Liabilities 18,560,337 15,927,245 15,550,252 16,745,469 16,027,027
Short-term Debt 1,808,930 1,640,958 1,404,947 3,104,071 3,585,210
Current Liabilities 11,974,338 10,806,238 10,000,239 11,421,924 11,627,539
Long-term Debt 2,882,263 1,698,194 2,471,132 2,503,230 2,755,446
Total Debt 4,691,193 3,339,152 3,876,079 5,607,300 6,340,656
Net Debt -2,682,220 -3,007,491 -394,460 1,673,132 3,426,510
Total Stockholders’ Equity 22,483,865 20,254,795 16,848,062 13,509,709 10,248,117
Total Liabilities & Stockholders’ Equity 41,044,202 36,182,040 32,398,314 30,255,179 26,275,144
Liability-to-Equity Ratio 82.60% 78.60% 92.30% 124.00% 156.40%
Debt-to-Equity Ratio 20.90% 16.50% 23.00% 41.50% 61.90%
Net Debt-to-Equity Ratio -11.90% -14.80% -2.30% 12.40% 33.40%
Consolidated Statement of Income*
Revenue 47,097,049 47,597,897 47,242,933 43,190,942 35,826,955
Cost of Sales 37,754,115 37,511,941 36,536,005 33,138,961 27,905,367
Cost of Sales (%) 80.20% 78.80% 77.30% 76.70% 77.90%
Gross Prot 9,342,934 10,085,956 10,706,928 10,051,981 7,921,588
Operating Prot 2,572,549 3,177,100 3,522,251 3,499,088 2,369,852
Margin (%) 5.50% 6.70% 7.50% 8.10% 6.60%
Pretax Prot 3,816,316 4,828,576 5,164,056 4,721,650 3,323,048
Net Prot 2,993,593 3,817,059 3,864,704 3,519,236 2,698,331
Margin (%) 6.40% 8.00% 8.20% 8.10% 7.50%
Consolidated Statement of Cash Flows*
Cash Flows from Operating Activities 2,363,825 4,776,593 4,345,425 4,745,189 5,272,537
Cash Flows from Investing Activities -2,983,406 -3,513,940 -2,842,577 -2,630,548 -2,296,053
Cash Flows from Financing Activities -986,491 -791,207 -1,810,114 -1,440,956 -3,343,298
Cash and Cash Equivalents, Beginning of Year 2,311,264 1,903,309 2,304,169 1,615,879 2,001,225
Net Increase (Decrease) 167,206 407,955 -400,860 688,290 -385,346
Cash and Cash Equivalents, End of Year 2,478,470 2,311,264 1,903,309 2,304,169 1,615,879
Credit Rating
Domestic KIS AA+ AA+ AA+ AA AA
KOREA Rating AA+ AA+ AA+ AA AA
Overseas Moody’s Baa1 Baa1 Baa1 Baa2 Baa3
S&P A- BBB+ BBB+ BBB BBB
(KRW in millions)
(KRW in millions)
(KRW in millions)
* Consolidated data based on K-GAAP for 2010 and K-IFRS for 2011-2014
2 3
Annual Report 2014