JetBlue Airlines 2004 Annual Report Download - page 70
Download and view the complete annual report
Please find page 70 of the 2004 JetBlue Airlines annual report below. You can navigate through the pages in the report by either clicking on the pages listed below, or by using the keyword search tool below to find specific information within the annual report.-
 1
1 -
2
-
3
-
4
-
5
-
6
-
7
-
8
-
9
-
10
-
11
-
12
-
13
-
14
-
15
-
16
-
17
-
18
-
19
-
20
-
21
-
22
-
23
-
24
-
25
-
26
-
27
-
28
-
29
-
30
-
31
-
32
-
33
-
34
-
35
-
36
-
37
-
38
-
39
-
40
-
41
-
42
-
43
-
44
-
45
-
46
-
47
-
48
-
49
-
50
-
51
-
52
-
53
-
54
-
55
-
56
-
57
-
58
-
59
-
 60
60 -
 61
61 -
 62
62 -
 63
63 -
 64
64 -
 65
65 -
 66
66 -
 67
67 -
 68
68 -
 69
69 -
 70
70 -
 71
71 -
 72
72 -
 73
73 -
 74
74 -
 75
75 -
 76
76 -
 77
77 -
 78
78 -
 79
79 -
 80
80 -
81
-
82
-
83
-
84
-
85
-
86
-
87
-
88
-
89
-
90
-
91
-
92
-
93
-
94
-
95
-
96
-
97
-
98
-
99
-
100
-
101
-
102
-
103
-
104
-
105
-
106
-
107
-
108
 |
 |

JETBLUE AIRWAYS CORPORATION
NOTES TO CONSOLIDATED FINANCIAL STATEMENTS (Continued)
December 31, 2004
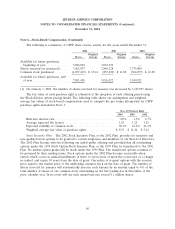
Note 6—Stock-Based Compensation (Continued)
following table discloses the number of options granted and certain weighted-average information of
options granted:
Number of Options Fair Value Exercise Price
Exercise price equals market price:
2004 ....................................... 3,305,300 $ 9.25 $ 25.35
2003 ....................................... 4,054,875 $ 12.94 $ 27.71
2002 ....................................... 5,204,250 $ 8.50 $ 17.43
Exercise price less than market price:
2002 ....................................... 1,284,535 $ 8.16 $ 6.00
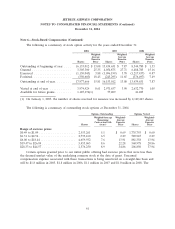
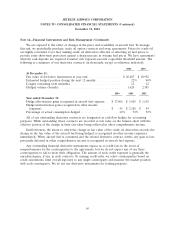
The fair value of each option is estimated on the date of grant using the Black-Scholes option
pricing model. The following table shows our assumptions and weighted average fair values of stock-
based compensation used to compute the proforma information for employee stock options included in
Note 1:
Year of Grant
2004 2003 2002
Risk-free interest rate ....................................... 3.1% 3.5% 4.2%
Average expected life of options (years) .......................... 4.6 6.3 6.4
Expected volatility of common stock ............................. 38.1% 41.5% 41.3%
Weighted average fair value of stock options ....................... $9.25 $ 12.94 $ 8.43
Because the Company’s stock options have characteristics significantly different from those of
traded options and because changes in the subjective input assumptions can materially affect the fair
value estimate, in management’s opinion, the existing models for valuing options do not necessarily
provide a reliable single measure of their fair values.
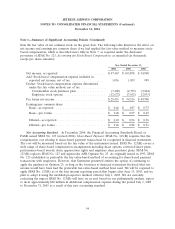
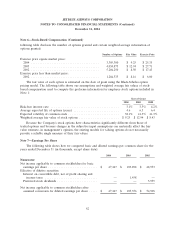
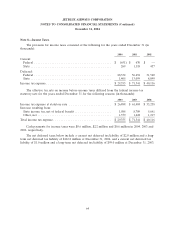
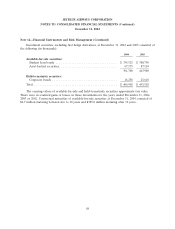
Note 7—Earnings Per Share
The following table shows how we computed basic and diluted earnings per common share for the
years ended December 31 (in thousands, except share data):
2004 2003 2002
Numerator:
Net income applicable to common stockholders for basic
earnings per share ............................ $ 47,467 $ 103,898 $ 48,953
Effective of dilutive securities:
Interest on convertible debt, net of profit sharing and
income taxes .............................. — 1,458 —
Preferred stock dividends ....................... — — 5,955
Net income applicable to common stockholders after
assumed conversion for diluted earnings per share ..... $ 47,467 $ 105,356 $ 54,908
62