JetBlue Airlines 2004 Annual Report Download - page 56
Download and view the complete annual report
Please find page 56 of the 2004 JetBlue Airlines annual report below. You can navigate through the pages in the report by either clicking on the pages listed below, or by using the keyword search tool below to find specific information within the annual report.-
 1
1 -
2
-
3
-
4
-
5
-
6
-
7
-
8
-
9
-
10
-
11
-
12
-
13
-
14
-
15
-
16
-
17
-
18
-
19
-
20
-
21
-
22
-
23
-
24
-
25
-
26
-
27
-
28
-
29
-
30
-
31
-
32
-
33
-
34
-
35
-
36
-
37
-
38
-
39
-
40
-
41
-
42
-
43
-
44
-
45
-
 46
46 -
 47
47 -
 48
48 -
 49
49 -
 50
50 -
 51
51 -
 52
52 -
 53
53 -
 54
54 -
 55
55 -
 56
56 -
 57
57 -
 58
58 -
 59
59 -
 60
60 -
 61
61 -
 62
62 -
 63
63 -
 64
64 -
 65
65 -
 66
66 -
67
-
68
-
69
-
70
-
71
-
72
-
73
-
74
-
75
-
76
-
77
-
78
-
79
-
80
-
81
-
82
-
83
-
84
-
85
-
86
-
87
-
88
-
89
-
90
-
91
-
92
-
93
-
94
-
95
-
96
-
97
-
98
-
99
-
100
-
101
-
102
-
103
-
104
-
105
-
106
-
107
-
108
 |
 |

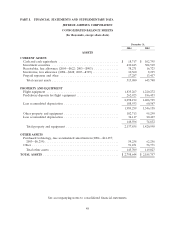
PART 8. FINANCIAL STATEMENTS AND SUPPLEMENTARY DATA
JETBLUE AIRWAYS CORPORATION
CONSOLIDATED BALANCE SHEETS
(In thousands, except share data)
December 31,
2004 2003
ASSETS
CURRENT ASSETS
Cash and cash equivalents .................................. $ 18,717 $ 102,795
Investment securities ...................................... 430,445 504,510
Receivables, less allowance (2004—$622; 2003—$903) .............. 38,271 16,723
Inventories, less allowance (2004—$628; 2003—$369) ............... 10,360 8,295
Prepaid expenses and other ................................. 17,287 13,417
Total current assets ...................................... 515,080 645,740
PROPERTY AND EQUIPMENT
Flight equipment ......................................... 1,835,267 1,220,272
Predelivery deposits for flight equipment ........................ 262,925 186,453
2,098,192 1,406,725
Less accumulated depreciation ............................... 108,933 60,567
1,989,259 1,346,158
Other property and equipment ............................... 182,713 95,299
Less accumulated depreciation ............................... 34,117 20,467
148,596 74,832
Total property and equipment .............................. 2,137,855 1,420,990
OTHER ASSETS
Purchased technology, less accumulated amortization (2004—$14,257;
2003—$6,259) .......................................... 54,258 62,256
Other ................................................. 91,451 56,771
Total other assets ....................................... 145,709 119,027
TOTAL ASSETS ........................................... $ 2,798,644 $ 2,185,757
See accompanying notes to consolidated financial statements.
48