JetBlue Airlines 2004 Annual Report Download - page 43
Download and view the complete annual report
Please find page 43 of the 2004 JetBlue Airlines annual report below. You can navigate through the pages in the report by either clicking on the pages listed below, or by using the keyword search tool below to find specific information within the annual report.-
 1
1 -
2
-
3
-
4
-
5
-
6
-
7
-
8
-
9
-
10
-
11
-
12
-
13
-
14
-
15
-
16
-
17
-
18
-
19
-
20
-
21
-
22
-
23
-
24
-
25
-
26
-
27
-
28
-
29
-
30
-
31
-
32
-
 33
33 -
 34
34 -
 35
35 -
 36
36 -
 37
37 -
 38
38 -
 39
39 -
 40
40 -
 41
41 -
 42
42 -
 43
43 -
 44
44 -
 45
45 -
 46
46 -
 47
47 -
 48
48 -
 49
49 -
 50
50 -
 51
51 -
 52
52 -
 53
53 -
54
-
55
-
56
-
57
-
58
-
59
-
60
-
61
-
62
-
63
-
64
-
65
-
66
-
67
-
68
-
69
-
70
-
71
-
72
-
73
-
74
-
75
-
76
-
77
-
78
-
79
-
80
-
81
-
82
-
83
-
84
-
85
-
86
-
87
-
88
-
89
-
90
-
91
-
92
-
93
-
94
-
95
-
96
-
97
-
98
-
99
-
100
-
101
-
102
-
103
-
104
-
105
-
106
-
107
-
108
 |
 |

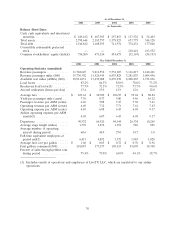
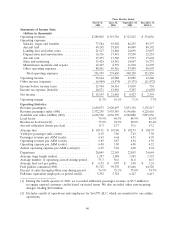
Year 2004 Compared to Year 2003
Our net income for the year 2004 decreased to $47.5 million from $103.9 million for the year 2003.
We had operating income of $112.9 million, a decrease of $55.9 million over 2003, and our operating
margin was 8.9%, down 8.0 points from 2003. This was our fourth straight year of profitable operations
and concluded our 16th consecutive profitable quarter.
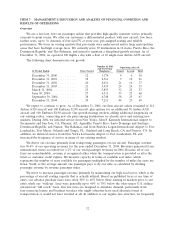
Diluted earnings per share was $0.43 and $0.96 for the years ended 2004 and 2003, respectively.
Our results for 2003 included $22.8 million in Emergency War Time Act compensation which, net of
profit sharing and income taxes, amounted to $11.5 million, or $0.11 per diluted share.
Operating Revenues. Operating revenues increased 26.8%, or $267.6 million, primarily due to an
increase in passenger revenues. Increased passengers resulting from a 35.3% increase in departures, or
$351.9 million, partially offset by a 7.3% decrease in yield, or $96.2 million, drove the increase in
passenger revenue of $255.7 million for the year 2004. Lower yields experienced during 2004 and a
1.3 point reduction in load factor were primarily attributable to an extremely competitive environment,
which included unprecedented fare discounting and frequent flyer offers by several airlines in most of
the markets we serve. These carriers also added back capacity that was taken out in 2003 at the onset
of hostilities in Iraq, which significantly impacted our East-West markets. Additionally, four major
hurricanes during the third quarter resulted in estimated lost revenue of $8 to $10 million. Other
revenue increased 35.9%, or $11.9 million, primarily due to increased change fees of $5.5 million
resulting from more passengers and LiveTV third party revenues of $3.2 million.
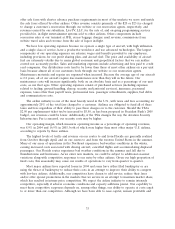
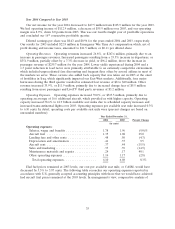
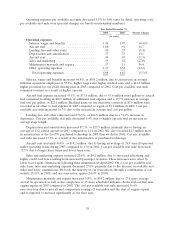
Operating Expenses. Operating expenses increased 39.0%, or $323.5 million, primarily due to
operating an average of 16.6 additional aircraft, which provided us with higher capacity. Operating
capacity increased 38.6% to 18.9 billion available seat miles due to scheduled capacity increases and
increased transcontinental flights over 2003. Operating expenses per available seat mile increased 0.3%
to 6.10 cents. In detail, operating costs per available seat mile were (percent changes are based on
unrounded numbers):
Year Ended December 31,
2004 2003 Percent Change
(in cents)
Operating expenses:
Salaries, wages and benefits ................. 1.78 1.96 (9.0)%
Aircraft fuel ............................ 1.35 1.08 25.0
Landing fees and other rents ................ .48 .50 (4.3)
Depreciation and amortization ............... .41 .37 9.5
Aircraft rent ............................ .37 .44 (15.5)
Sales and marketing ....................... .33 .39 (14.9)
Maintenance materials and repairs ............ .24 .17 40.1
Other operating expenses ................... 1.14 1.17 (2.8)
Total operating expenses .................. 6.10 6.08 0.3%
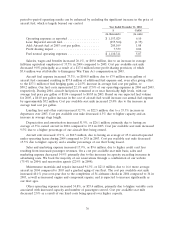
Had fuel prices remained at 2003 levels, our cost per available seat mile, or CASM, would have
decreased by 3.5% to 5.87 cents. The following table reconciles our operating expenses reported in
accordance with U.S. generally accepted accounting principles with those that we would have achieved
had aircraft fuel prices remained at the 2003 levels. In management’s view, comparative analysis of
35