JetBlue Airlines 2004 Annual Report Download - page 38
Download and view the complete annual report
Please find page 38 of the 2004 JetBlue Airlines annual report below. You can navigate through the pages in the report by either clicking on the pages listed below, or by using the keyword search tool below to find specific information within the annual report.-
 1
1 -
2
-
3
-
4
-
5
-
6
-
7
-
8
-
9
-
10
-
11
-
12
-
13
-
14
-
15
-
16
-
17
-
18
-
19
-
20
-
21
-
22
-
23
-
24
-
25
-
26
-
27
-
 28
28 -
 29
29 -
 30
30 -
 31
31 -
 32
32 -
 33
33 -
 34
34 -
 35
35 -
 36
36 -
 37
37 -
 38
38 -
 39
39 -
 40
40 -
 41
41 -
 42
42 -
 43
43 -
 44
44 -
 45
45 -
 46
46 -
 47
47 -
 48
48 -
49
-
50
-
51
-
52
-
53
-
54
-
55
-
56
-
57
-
58
-
59
-
60
-
61
-
62
-
63
-
64
-
65
-
66
-
67
-
68
-
69
-
70
-
71
-
72
-
73
-
74
-
75
-
76
-
77
-
78
-
79
-
80
-
81
-
82
-
83
-
84
-
85
-
86
-
87
-
88
-
89
-
90
-
91
-
92
-
93
-
94
-
95
-
96
-
97
-
98
-
99
-
100
-
101
-
102
-
103
-
104
-
105
-
106
-
107
-
108
 |
 |

As of December 31,
2004 2003 2002 2001 2000
(in thousands)
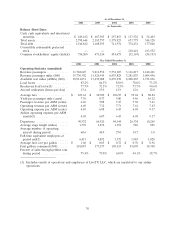
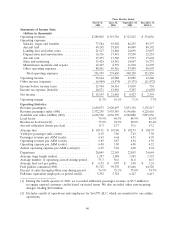
Balance Sheet Data:
Cash, cash equivalents and investment
securities .................... $ 449,162 $ 607,305 $ 257,853 $ 117,522 $ 34,403
Total assets .................... 2,798,644 2,185,757 1,378,923 673,773 344,128
Total debt ..................... 1,544,812 1,108,595 711,931 374,431 177,048
Convertible redeemable preferred
stock .......................———210,441 163,552
Common stockholders’ equity (deficit) 756,200 671,136 414,673 (32,167) (54,153)
Year Ended December 3l,
2004 2003 2002 2001 2000
Operating Statistics (unaudited)
Revenue passengers ............ 11,782,625 9,011,552 5,752,105 3,116,817 1,144,421
Revenue passenger miles (000) .... 15,730,302 11,526,945 6,835,828 3,281,835 1,004,496
Available seat miles (ASMs) (000) . . 18,911,051 13,639,488 8,239,938 4,208,267 1,371,836
Load factor .................. 83.2% 84.5% 83.0% 78.0% 73.2%
Breakeven load factor(5) ........ 77.7% 72.5% 71.5% 73.7% 90.6%
Aircraft utilization (hours per day) . 13.4 13.0 12.9 12.6 12.0
Average fare ................. $ 103.61 $ 107.09 $ 106.95 $ 99.62 $ 88.84
Yield per passenger mile (cents) . . . 7.76 8.37 9.00 9.46 10.12
Passenger revenue per ASM (cents) . 6.46 7.08 7.47 7.38 7.41
Operating revenue per ASM (cents) 6.69 7.32 7.71 7.61 7.63
Operating expense per ASM (cents) 6.10 6.08 6.43 6.98 9.17
Airline operating expense per ASM
(cents)(5) .................. 6.03 6.07 6.43 6.98 9.17
Departures ................... 90,532 66,920 44,144 26,334 10,265
Average stage length (miles) ...... 1,339 1,272 1,152 986 825
Average number of operating
aircraft during period .......... 60.6 44.0 27.0 14.7 5.8
Full-time equivalent employees at
period end(5) ............... 6,413 4,892 3,572 1,983 1,028
Average fuel cost per gallon ...... $ 1.06 $ 0.85 $ 0.72 $ 0.76 $ 0.96
Fuel gallons consumed (000) ...... 241,087 173,157 105,515 55,095 18,340
Percent of sales through jetblue.com
during period ............... 75.4% 73.0% 63.0% 44.1% 28.7%
(5) Excludes results of operations and employees of LiveTV, LLC, which are unrelated to our airline
operations.
30