JetBlue Airlines 2004 Annual Report Download - page 46
Download and view the complete annual report
Please find page 46 of the 2004 JetBlue Airlines annual report below. You can navigate through the pages in the report by either clicking on the pages listed below, or by using the keyword search tool below to find specific information within the annual report.-
 1
1 -
2
-
3
-
4
-
5
-
6
-
7
-
8
-
9
-
10
-
11
-
12
-
13
-
14
-
15
-
16
-
17
-
18
-
19
-
20
-
21
-
22
-
23
-
24
-
25
-
26
-
27
-
28
-
29
-
30
-
31
-
32
-
33
-
34
-
35
-
 36
36 -
 37
37 -
 38
38 -
 39
39 -
 40
40 -
 41
41 -
 42
42 -
 43
43 -
 44
44 -
 45
45 -
 46
46 -
 47
47 -
 48
48 -
 49
49 -
 50
50 -
 51
51 -
 52
52 -
 53
53 -
 54
54 -
 55
55 -
 56
56 -
57
-
58
-
59
-
60
-
61
-
62
-
63
-
64
-
65
-
66
-
67
-
68
-
69
-
70
-
71
-
72
-
73
-
74
-
75
-
76
-
77
-
78
-
79
-
80
-
81
-
82
-
83
-
84
-
85
-
86
-
87
-
88
-
89
-
90
-
91
-
92
-
93
-
94
-
95
-
96
-
97
-
98
-
99
-
100
-
101
-
102
-
103
-
104
-
105
-
106
-
107
-
108
 |
 |

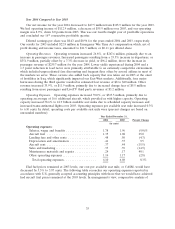
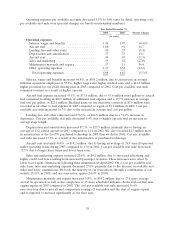
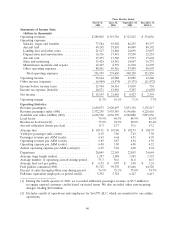
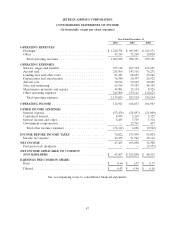
Operating expenses per available seat mile decreased 5.5% to 6.08 cents. In detail, operating costs
per available seat mile were (percent changes are based on unrounded numbers):
Year Ended December 31,
2003 2002 Percent Change
(in cents)
Operating expenses:
Salaries, wages and benefits ................. 1.96 1.97 (0.4)%
Aircraft fuel ............................ 1.08 .92 16.7
Landing fees and other rents ................ .50 .53 (5.4)
Depreciation and amortization ............... .37 .33 13.1
Aircraft rent ............................ .44 .49 (11.3)
Sales and marketing ....................... .39 .54 (27.0)
Maintenance materials and repairs ............ .17 .11 56.4
Other operating expenses ................... 1.17 1.54 (24.2)
Total operating expenses .................. 6.08 6.43 (5.5)%
Salaries, wages and benefits increased 64.8%, or $105.2 million, due to an increase in average
full-time equivalent employees of 55.9%, higher wage rates, higher medical costs and a $14.2 million
higher provision for our profit sharing plan in 2003 compared to 2002. Cost per available seat mile
remained constant as a result of higher capacity.
Aircraft fuel expense increased 93.1%, or $71.0 million, due to 67.6 million more gallons of aircraft
fuel consumed resulting in $48.9 million of additional fuel expense and a 17.7% increase in average
fuel cost per gallon, or $22.1 million. Realized gains on our derivative contracts of $3.6 million were
recorded as an offset to fuel expense in 2003 compared to a gain of $1.2 million in 2002. Cost per
available seat mile increased 16.7% due to the increase in average fuel cost per gallon.
Landing fees and other rents increased 56.5%, or $24.8 million, due to a 51.6% increase in
departures. Cost per available seat mile decreased 5.4% due to higher capacity and an increase in
average stage length.
Depreciation and amortization increased 87.2%, or $23.5 million, primarily due to having an
average of 23.2 owned aircraft in 2003 compared to 14.0 in 2002. We also recorded $4.3 million more
in amortization of the LiveTV purchased technology in 2003 than we did in 2002. Cost per available
seat mile increased 13.1% as a result of the amortization of purchased technology.
Aircraft rent increased 46.8%, or $19.2 million, due to having an average of 20.8 aircraft operated
under operating leases during 2003 compared to 13.0 in 2002. Cost per available seat mile decreased
11.3% due to longer lease terms and lower lease rates.
Sales and marketing expense increased 20.8%, or $9.2 million, due to increased advertising and
higher credit card fees resulting from increased passenger revenues. These increases were offset by
lower travel agent commissions following their elimination in April 2002. On a cost per available seat
mile basis, sales and marketing expense decreased 27.0% primarily due to the increase in available seat
miles and lower commissions. We book the majority of our reservations through a combination of our
website (73.0% in 2003) and our reservation agents (24.6% in 2003).
Maintenance materials and repairs increased 159%, or $14.2 million, due to 17.0 more average
aircraft in operation as well as the completion of 15 more scheduled airframe checks and our first nine
engine repairs in 2003 compared to 2002. The cost per available seat mile increased 56.4%
year-over-year due to aircraft and components coming off warranties and the start of engine repairs,
and is expected to increase significantly as our fleet ages.
38