JetBlue Airlines 2004 Annual Report Download - page 49
Download and view the complete annual report
Please find page 49 of the 2004 JetBlue Airlines annual report below. You can navigate through the pages in the report by either clicking on the pages listed below, or by using the keyword search tool below to find specific information within the annual report.-
 1
1 -
2
-
3
-
4
-
5
-
6
-
7
-
8
-
9
-
10
-
11
-
12
-
13
-
14
-
15
-
16
-
17
-
18
-
19
-
20
-
21
-
22
-
23
-
24
-
25
-
26
-
27
-
28
-
29
-
30
-
31
-
32
-
33
-
34
-
35
-
36
-
37
-
38
-
 39
39 -
 40
40 -
 41
41 -
 42
42 -
 43
43 -
 44
44 -
 45
45 -
 46
46 -
 47
47 -
 48
48 -
 49
49 -
 50
50 -
 51
51 -
 52
52 -
 53
53 -
 54
54 -
 55
55 -
 56
56 -
 57
57 -
 58
58 -
 59
59 -
60
-
61
-
62
-
63
-
64
-
65
-
66
-
67
-
68
-
69
-
70
-
71
-
72
-
73
-
74
-
75
-
76
-
77
-
78
-
79
-
80
-
81
-
82
-
83
-
84
-
85
-
86
-
87
-
88
-
89
-
90
-
91
-
92
-
93
-
94
-
95
-
96
-
97
-
98
-
99
-
100
-
101
-
102
-
103
-
104
-
105
-
106
-
107
-
108
 |
 |
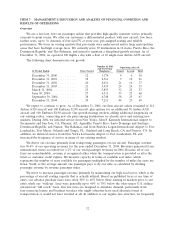
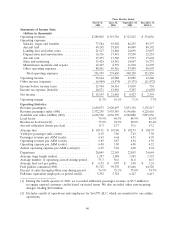
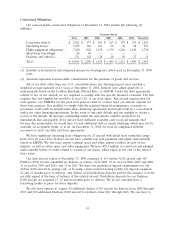
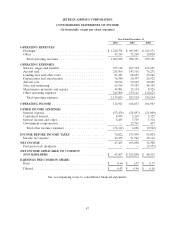
Although we have continued to experience significant revenue growth, this trend may not continue.
We expect our expenses to continue to increase significantly as we acquire additional aircraft, as our
fleet ages and as we expand the frequency of flights in existing markets and enter into new markets.
Accordingly, the comparison of the financial data for the quarterly periods presented may not be
meaningful. In addition, we expect our operating results to fluctuate significantly from quarter to
quarter in the future as a result of various factors, many of which are outside our control.
Consequently, we believe that quarter-to-quarter comparisons of our operating results may not
necessarily be meaningful and you should not rely on our results for any one quarter as an indication
of our future performance.
Liquidity and Capital Resources
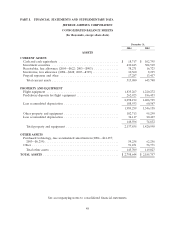
At December 31, 2004, we had cash and cash equivalents of $18.7 million and investment securities
of $430.4 million, compared to cash and cash equivalents of $102.8 million and investment securities of
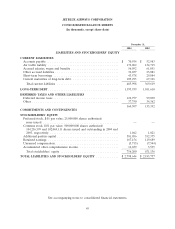
$504.5 million at December 31, 2003. We presently have no lines of credit other than a short-term
borrowing facility for certain aircraft predelivery deposits. This facility allowed for borrowings of up to
$48.0 million prior to November 2005, with $43.6 million in borrowings outstanding at December 31,
2004.
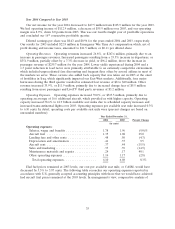
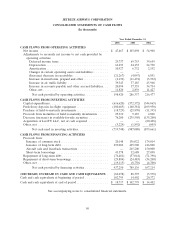
We rely primarily on cash flows from operations to provide working capital for current and future
operations. Cash flows from operating activities totaled $198.4 million in 2004, $286.3 million in 2003
and $216.5 million in 2002. The $87.9 million decline in cash flows from operations in 2004 compared
to 2003 was primarily a result of a 7.3% decline in yields and a 24.5% increase in fuel prices, offset by
a 36.5% increase in revenue passenger miles. The increase in operating cash flows in 2003 compared to
2002 was primarily due to the growth of our business. Cash flows from operations were also impacted
by the receipt of government compensation, which was $22.8 million less in 2004 compared to 2003 and
$19.6 million higher in 2003 compared to 2002. Net cash used in investing and financing activities was
$282.5 million in 2004, $197.9 million in 2003 and $222.4 million in 2002.
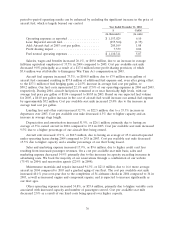
Investing Activities. During 2004, capital expenditures related to our purchase of flight equipment
included expenditures of $510.7 million for 15 Airbus aircraft and one spare engine, $180.7 million for
flight equipment deposits and $18.7 million for spare part purchases. Capital expenditures for other
property and equipment, including ground equipment purchases and facilities improvements, were
$87.2 million. Net cash provided from the sale and purchase of available-for-sale securities was
$76.2 million.
During 2003, capital expenditures related to our purchase of flight equipment included
expenditures of $509.6 million for 15 Airbus aircraft and one spare engine, $160.4 million for flight
equipment deposits and $20.1 million for spare part purchases. Capital expenditures for other property
and equipment, including ground equipment purchases and facilities improvements, were $42.9 million.
Net cash used in the sale and purchase of available-for-sale securities was $235.6 million.
Financing Activities. Financing activities during 2004 consisted primarily of (1) the financing of
13 aircraft with $431.0 million in floating rate equipment notes purchased with proceeds from our
public offering of pass-through certificates, (2) the financing of two aircraft with $68.0 million of
12-year floating rate equipment notes issued to a European bank, (3) the repayment of three spare
engine notes totaling $9.1 million, (4) scheduled maturities of $67.4 million of debt and (5) net
short-term borrowings of $13.7 million.
On March 24, 2004, we completed a public offering of $431.0 million of pass-through certificates,
Series 2004-1, to finance 13 new Airbus A320 aircraft, all of which were delivered by December 2004.
On November 15, 2004, we completed a separate public offering of $498.2 million of pass-through
certificates, Series 2004-2, to finance all of the 15 new Airbus A320 aircraft deliveries scheduled for
2005. The pre-funded cash proceeds from the sale of the Series 2004-2 certificates are being held in
41