JetBlue Airlines 2004 Annual Report Download - page 42
Download and view the complete annual report
Please find page 42 of the 2004 JetBlue Airlines annual report below. You can navigate through the pages in the report by either clicking on the pages listed below, or by using the keyword search tool below to find specific information within the annual report.-
 1
1 -
2
-
3
-
4
-
5
-
6
-
7
-
8
-
9
-
10
-
11
-
12
-
13
-
14
-
15
-
16
-
17
-
18
-
19
-
20
-
21
-
22
-
23
-
24
-
25
-
26
-
27
-
28
-
29
-
30
-
31
-
 32
32 -
 33
33 -
 34
34 -
 35
35 -
 36
36 -
 37
37 -
 38
38 -
 39
39 -
 40
40 -
 41
41 -
 42
42 -
 43
43 -
 44
44 -
 45
45 -
 46
46 -
 47
47 -
 48
48 -
 49
49 -
 50
50 -
 51
51 -
 52
52 -
53
-
54
-
55
-
56
-
57
-
58
-
59
-
60
-
61
-
62
-
63
-
64
-
65
-
66
-
67
-
68
-
69
-
70
-
71
-
72
-
73
-
74
-
75
-
76
-
77
-
78
-
79
-
80
-
81
-
82
-
83
-
84
-
85
-
86
-
87
-
88
-
89
-
90
-
91
-
92
-
93
-
94
-
95
-
96
-
97
-
98
-
99
-
100
-
101
-
102
-
103
-
104
-
105
-
106
-
107
-
108
 |
 |
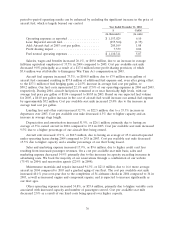
continue to grow, the highly competitive nature of the airline industry could prevent us from attaining
the passenger traffic required to maintain profitable operations in new markets.
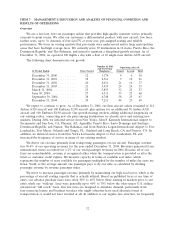
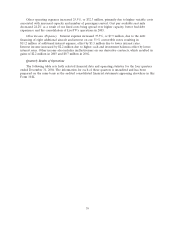
Outlook for 2005
Industry forecasts for 2005 anticipate U.S. capacity increases of between 4% to 5% over 2004. We
expect our operating capacity to increase approximately 27% to 29% over 2004 with the addition of
15 new Airbus A320 and seven Embraer E190 aircraft in 2005. The E190 will represent less than
one-half of 1% of our total expected 2005 available seat miles. Average stage length is expected to
remain unchanged in 2005. Higher maintenance costs are expected to be partially offset by our fixed
costs being spread over higher projected available seat miles. Fuel costs have risen sharply in 2004 and
may increase further. Although we have hedged 22% of our anticipated fuel requirements for 2005, we
expect to incur higher fuel costs. Assuming fuel prices of $1.17 per gallon, net of hedging, our cost per
available seat mile is expected to be slightly higher than 2004 and our operating margin is projected to
be between 7% to 9% for 2005. Further actions by our competitors, including Delta Air Lines’ recently
changed fare structure, could also impact our revenues and operating margins.
We expect to take delivery of our first Embraer E190 aircraft beginning in August 2005 and plan
to place it into service in the fourth quarter of 2005. The addition of the Embraer E190 to our fleet
will increase our flexibility and better position us to take advantage of market opportunities. We intend
to capitalize on revenue opportunities that would not have been available to us with only one aircraft
type in our fleet, such as establishing non-stop service in markets where carriers currently do not
provide non-stop service. We expect to incur one-time charges associated with integrating a new aircraft
type into our fleet prior to it entering revenue service, including obtaining necessary certifications, the
hiring and training of new pilots, technicians and flight attendants, and outfitting a new aircraft type
with LiveTV.
In December 2004, the Financial Accounting Standards Board, or FASB, issued SFAS No. 123(R),
Share-Based Payment, which requires us to record stock-based compensation expense for all employee
stock options and our stock purchase plan using the fair value method. This change will have a
significant impact on our results of operations, although it will have no impact on our overall financial
position. It will also affect our ability to provide accurate guidance on our future reported financial
results due to the difficulty in projecting the stock price used to establish the value of stock options.
We plan to adopt this change prospectively on July 1, 2005, and we are currently assessing
implementation options, including possible modifications to our 2002 Stock Incentive Plan. However,
based on our pro forma calculations, we expect to record approximately $20 million in additional
non-cash stock-based compensation expense for the second half of 2005, which will also result in an
increase in our tax rate due to the non-deductibility of these charges. See Note 1 to our consolidated
financial statements for the impact this standard would have had on our prior period financial results.
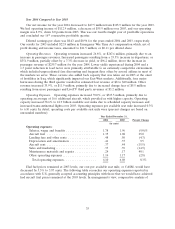
Results of Operations
The U.S. domestic airline environment continues to be extremely challenging as a result of two
factors. First, is the extremely weak revenue environment caused by widespread price competition and
continued increases in industry capacity. Capacity was added in many of our markets, especially in the
New York—California markets. We have also encountered aggressive responses from our competitors
trying to protect or regain market share through fare matching, price discounts, targeted sale
promotions and frequent flyer travel initiatives, all of which are usually matched by other airlines.
Second, is the record high aircraft fuel prices caused by the sharp rise in crude oil prices. As a result of
these external factors that are largely outside of our control, we saw a significant reduction in our
profitability for the year.
34