JetBlue Airlines 2004 Annual Report Download - page 69
Download and view the complete annual report
Please find page 69 of the 2004 JetBlue Airlines annual report below. You can navigate through the pages in the report by either clicking on the pages listed below, or by using the keyword search tool below to find specific information within the annual report.-
 1
1 -
2
-
3
-
4
-
5
-
6
-
7
-
8
-
9
-
10
-
11
-
12
-
13
-
14
-
15
-
16
-
17
-
18
-
19
-
20
-
21
-
22
-
23
-
24
-
25
-
26
-
27
-
28
-
29
-
30
-
31
-
32
-
33
-
34
-
35
-
36
-
37
-
38
-
39
-
40
-
41
-
42
-
43
-
44
-
45
-
46
-
47
-
48
-
49
-
50
-
51
-
52
-
53
-
54
-
55
-
56
-
57
-
58
-
 59
59 -
 60
60 -
 61
61 -
 62
62 -
 63
63 -
 64
64 -
 65
65 -
 66
66 -
 67
67 -
 68
68 -
 69
69 -
 70
70 -
 71
71 -
 72
72 -
 73
73 -
 74
74 -
 75
75 -
 76
76 -
 77
77 -
 78
78 -
 79
79 -
80
-
81
-
82
-
83
-
84
-
85
-
86
-
87
-
88
-
89
-
90
-
91
-
92
-
93
-
94
-
95
-
96
-
97
-
98
-
99
-
100
-
101
-
102
-
103
-
104
-
105
-
106
-
107
-
108
 |
 |

JETBLUE AIRWAYS CORPORATION
NOTES TO CONSOLIDATED FINANCIAL STATEMENTS (Continued)
December 31, 2004
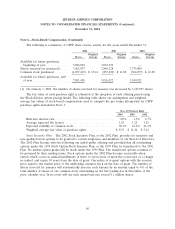
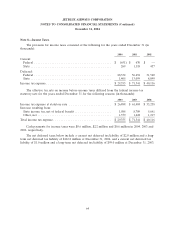
Note 6—Stock-Based Compensation (Continued)
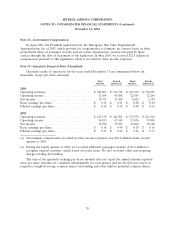
The following is a summary of stock option activity for the years ended December 31:
2004 2003 2002
Weighted Weighted Weighted
Average Average Average
Exercise Exercise Exercise
Shares Price Shares Price Shares Price
Outstanding at beginning of year .... 16,153,012 $ 13.08 13,439,631 $ 7.87 8,544,780 $ 1.33
Granted ...................... 3,305,300 25.35 4,054,875 27.71 6,488,785 15.16
Exercised ..................... (1,130,043) 3.88 (1,096,199) 3.78 (1,217,437) 0.87
Forfeited ...................... (350,603) 18.45 (245,295) 11.65 (376,497) 7.49
Outstanding at end of year ......... 17,977,666 15.81 16,153,012 13.08 13,439,631 7.87
Vested at end of year ............ 3,974,924 8.61 2,971,637 3.90 2,632,770 1.05
Available for future grants ......... 1,185,276(1) 57,209 41,285
(1) On January 1, 2005, the number of shares reserved for issuance was increased by 4,169,463 shares.
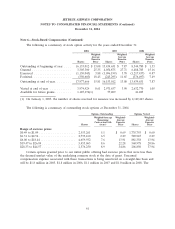
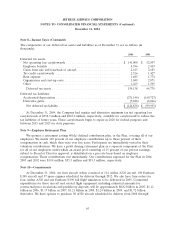
The following is a summary of outstanding stock options at December 31, 2004:
Options Outstanding Options Vested
Weighted-Average Weighted- Weighted-
Remaining Average Average
Contractual Life Exercise Exercise
Shares (years) Price Shares Price
Range of exercise prices
$0.49 to $1.09 ..................... 2,553,261 5.1 $ 0.69 1,735,793 $ 0.60
$1.31 to $2.56 ..................... 2,733,160 6.5 2.29 589,945 2.29
$6.00 to $18.44 .................... 4,659,932 7.6 13.91 881,358 13.94
$19.47 to $26.89 ................... 5,455,063 8.6 22.28 560,978 20.86
$28.33 to $44.57 ................... 2,576,250 8.9 34.86 206,850 37.94
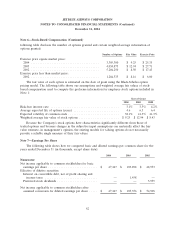
Certain options granted prior to our initial public offering had exercise prices that were less than
the deemed market value of the underlying common stock at the date of grant. Unearned
compensation expense associated with these transactions is being amortized on a straight-line basis and
will be $1.8 million in 2005, $1.8 million in 2006, $1.1 million in 2007 and $1.0 million in 2008. The
61