JetBlue Airlines 2004 Annual Report Download - page 15
Download and view the complete annual report
Please find page 15 of the 2004 JetBlue Airlines annual report below. You can navigate through the pages in the report by either clicking on the pages listed below, or by using the keyword search tool below to find specific information within the annual report.
Competition within the domestic airline industry intensified during 2004. The migration of
fare-conscious travelers away from traditional major U.S. airlines and their deteriorating market share
has forced some of these airlines to undertake broad cost-cutting measures and to reevaluate their
basic business models as they try to remain viable. As a result, two major airlines created their own
low-fare operations. During 2004, American announced plans to exit certain of its markets and
concentrate on expanding operations out of its Dallas Ft. Worth hub and Delta announced plans to
significantly decrease its operations out of its Dallas Ft. Worth hub and expand its operations out of its
Salt Lake City and Atlanta hubs. Most recently, in January 2005, Delta reduced and simplified its fare
structure, eliminated many of its ticketing restrictions and reduced change fees to $50. Under its new
structure, Delta’s one-way maximum domestic coach fare of $499, while significantly lower than its
previous maximum fare, is still higher than any fares charged by us or by most other low-fare airlines.
These new fares and policies have been matched by most other major airlines. Industry forecasts for
2005 anticipate U.S. capacity increases of 4% to 5% over 2004, representing the second straight year of
capacity growth after reductions in 2003 and 2002. We expect the extremely competitive nature of the
industry to continue.
Airlines also frequently participate in marketing alliances, which generally provide for code-sharing,
frequent flyer program reciprocity, coordinated flight schedules that provide for convenient connections
and other joint marketing activities. These alliances also permit an airline to market flights operated by
other alliance airlines as its own. The benefits of broad networks offered to customers could attract
more customers to these networks. We do not currently participate in any marketing alliances, interline
or offer joint fares with other airlines, nor do we have any commuter feeder relationships.
The airline industry also faces competition from ground transportation alternatives. Video
teleconferencing and other methods of electronic communication may also add a new dimension of
competition to the industry as business travelers seek lower-cost substitutes for air travel.
Routes and Schedules
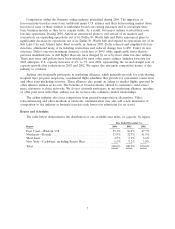
The table below demonstrates the distribution of our available seat miles, or capacity, by region:
Year Ended December 31,
Region 2004 2003 2002
East Coast—Western U.S. .......................... 55.1% 56.2% 47.7%
Northeast—Florida ............................... 33.9% 32.7% 41.9%
Short-haul ..................................... 4.5% 5.9% 6.6%
New York—Caribbean, including Puerto Rico ........... 6.5% 5.2% 3.8%
Total ......................................... 100.0% 100.0% 100.0%
7


