JetBlue Airlines 2004 Annual Report Download - page 40
Download and view the complete annual report
Please find page 40 of the 2004 JetBlue Airlines annual report below. You can navigate through the pages in the report by either clicking on the pages listed below, or by using the keyword search tool below to find specific information within the annual report.-
 1
1 -
2
-
3
-
4
-
5
-
6
-
7
-
8
-
9
-
10
-
11
-
12
-
13
-
14
-
15
-
16
-
17
-
18
-
19
-
20
-
21
-
22
-
23
-
24
-
25
-
26
-
27
-
28
-
29
-
 30
30 -
 31
31 -
 32
32 -
 33
33 -
 34
34 -
 35
35 -
 36
36 -
 37
37 -
 38
38 -
 39
39 -
 40
40 -
 41
41 -
 42
42 -
 43
43 -
 44
44 -
 45
45 -
 46
46 -
 47
47 -
 48
48 -
 49
49 -
 50
50 -
51
-
52
-
53
-
54
-
55
-
56
-
57
-
58
-
59
-
60
-
61
-
62
-
63
-
64
-
65
-
66
-
67
-
68
-
69
-
70
-
71
-
72
-
73
-
74
-
75
-
76
-
77
-
78
-
79
-
80
-
81
-
82
-
83
-
84
-
85
-
86
-
87
-
88
-
89
-
90
-
91
-
92
-
93
-
94
-
95
-
96
-
97
-
98
-
99
-
100
-
101
-
102
-
103
-
104
-
105
-
106
-
107
-
108
 |
 |

ITEM 7. MANAGEMENT’S DISCUSSION AND ANALYSIS OF FINANCIAL CONDITION AND
RESULTS OF OPERATIONS
Overview
We are a low-fare, low-cost passenger airline that provides high-quality customer service primarily
on point-to-point routes. We offer our customers a differentiated product, with new aircraft, low fares,
leather seats, up to 36 channels of free LiveTV at every seat, pre-assigned seating and reliable
performance. We focus on serving markets that previously were underserved and/or large metropolitan
areas that have had high average fares. We currently serve 30 destinations in 12 states, Puerto Rico, the
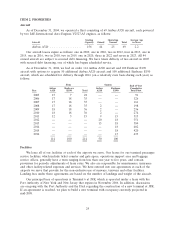
Dominican Republic and The Bahamas, and intend to maintain a disciplined growth strategy. As of
December 31, 2004, we operated 300 flights a day with a fleet of 69 single-class Airbus A320 aircraft.
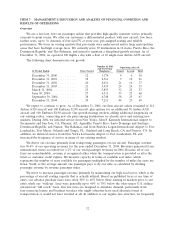
The following chart demonstrates our growth:
Number of Full Operating Aircraft
and Part-Time
At Period Ended Cities Served Employees Owned Leased Total
December 31, 2000 ........... 12 1,174 4 6 10
December 31, 2001 ........... 18 2,361 9 12 21
December 31, 2002 ........... 20 4,011 21 16 37
December 31, 2003 ........... 21 5,433 29 24 53
March 31, 2004 .............. 23 5,833 32 25 57
June 30, 2004 ............... 27 6,311 35 25 60
September 30, 2004 .......... 28 6,748 38 25 63
December 31, 2004 ........... 30 7,211 44 25 69
We expect to continue to grow. As of December 31, 2004, our firm aircraft orders consisted of 114
Airbus A320 aircraft and 100 Embraer E190 aircraft, plus options for an additional 50 Airbus A320
aircraft and 100 Embraer E190 aircraft. Our growth strategy involves adding additional frequencies on
our existing routes, connecting new city pairs among destinations we already serve and entering new
markets. During 2004, we initiated service from New York’s John F. Kennedy International Airport to
Sacramento and San Jose, CA, Phoenix, AZ, Aguadilla, Puerto Rico, Santo Domingo and Santiago,
Dominican Republic and Nassau, The Bahamas, and from Boston’s Logan International Airport to Fort
Lauderdale, Fort Myers, Orlando and Tampa, FL, Oakland and Long Beach, CA and Denver, CO. In
addition, we initiated service from New York’s LaGuardia Airport to Fort Lauderdale, FL and
increased the frequency of service in many of our existing markets.
We derive our revenue primarily from transporting passengers on our aircraft. Passenger revenue
was 96.4% of our operating revenues for the year ended December 31, 2004. Revenues generated from
international routes accounted for 1.2% of our total passenger revenues in 2004. Because all of our
fares are nonrefundable, revenue is recognized either when the transportation is provided or after the
ticket or customer credit expires. We measure capacity in terms of available seat miles, which
represents the number of seats available for passengers multiplied by the number of miles the seats are
flown. Yield, or the average amount one passenger pays to fly one mile, is calculated by dividing
passenger revenue by revenue passenger miles.
We strive to increase passenger revenue primarily by maintaining our high load factor, which is the
percentage of aircraft seating capacity that is actually utilized. Based on published fares at our time of
entry, our advance purchase fares were often 30% to 40% below those existing in markets prior to our
entry, while our ‘‘walk-up’’ fares were generally up to 60% to 70% below the other major U.S. airlines’
unrestricted ‘‘full coach’’ fares. Our low fares are designed to stimulate demand, particularly from
fare-conscious leisure and business travelers who might otherwise have used alternate forms of
transportation or would not have traveled at all. In addition to our regular fare structure, we frequently
32