JetBlue Airlines 2004 Annual Report Download - page 58
Download and view the complete annual report
Please find page 58 of the 2004 JetBlue Airlines annual report below. You can navigate through the pages in the report by either clicking on the pages listed below, or by using the keyword search tool below to find specific information within the annual report.-
 1
1 -
2
-
3
-
4
-
5
-
6
-
7
-
8
-
9
-
10
-
11
-
12
-
13
-
14
-
15
-
16
-
17
-
18
-
19
-
20
-
21
-
22
-
23
-
24
-
25
-
26
-
27
-
28
-
29
-
30
-
31
-
32
-
33
-
34
-
35
-
36
-
37
-
38
-
39
-
40
-
41
-
42
-
43
-
44
-
45
-
46
-
47
-
 48
48 -
 49
49 -
 50
50 -
 51
51 -
 52
52 -
 53
53 -
 54
54 -
 55
55 -
 56
56 -
 57
57 -
 58
58 -
 59
59 -
 60
60 -
 61
61 -
 62
62 -
 63
63 -
 64
64 -
 65
65 -
 66
66 -
 67
67 -
 68
68 -
69
-
70
-
71
-
72
-
73
-
74
-
75
-
76
-
77
-
78
-
79
-
80
-
81
-
82
-
83
-
84
-
85
-
86
-
87
-
88
-
89
-
90
-
91
-
92
-
93
-
94
-
95
-
96
-
97
-
98
-
99
-
100
-
101
-
102
-
103
-
104
-
105
-
106
-
107
-
108
 |
 |

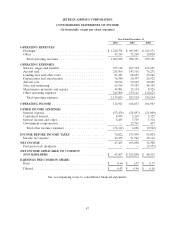
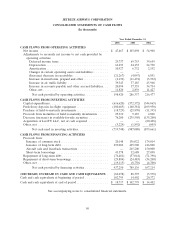
JETBLUE AIRWAYS CORPORATION
CONSOLIDATED STATEMENTS OF CASH FLOWS
(In thousands)
Year Ended December 31,
2004 2003 2002
CASH FLOWS FROM OPERATING ACTIVITIES
Net income ....................................... $ 47,467 $ 103,898 $ 54,908
Adjustments to reconcile net income to net cash provided by
operating activities:
Deferred income taxes ............................ 29,737 69,753 39,659
Depreciation ................................... 66,493 44,133 24,730
Amortization ................................... 10,927 6,732 2,192
Changes in certain operating assets and liabilities: ........ — —
(Increase) decrease in receivables .................... (21,267) (4,047) 6,851
Increase in inventories, prepaid and other .............. (6,194) (11,491) (3,992)
Increase in air traffic liability ....................... 39,343 37,185 45,968
Increase in accounts payable and other accrued liabilities . . . 20,094 37,335 34,734
Other, net ..................................... 11,820 2,839 11,427
Net cash provided by operating activities ............. 198,420 286,337 216,477
CASH FLOWS FROM INVESTING ACTIVITIES
Capital expenditures ................................. (616,620) (572,572) (544,065)
Predelivery deposits for flight equipment .................. (180,685) (160,381) (109,950)
Purchase of held-to-maturity investments .................. (18,729) (25,870) (11,395)
Proceeds from maturities of held-to-maturity investments ...... 25,310 9,185 2,000
Decrease (increase) in available-for-sale securities ........... 76,200 (235,550) (135,200)
Acquisition of LiveTV, LLC, net of cash acquired ........... — — (80,448)
Other, net ........................................ (5,224) (1,892) (603)
Net cash used in investing activities ................. (719,748) (987,080) (879,661)
CASH FLOWS FROM FINANCING ACTIVITIES
Proceeds from:
Issuance of common stock ........................... 20,148 136,022 174,014
Issuance of long-term debt .......................... 499,004 445,500 416,000
Aircraft sale and leaseback transactions ................. — 265,200 150,000
Short-term borrowings ............................. 43,578 32,688 27,098
Repayment of long-term debt .......................... (76,481) (57,041) (71,398)
Repayment of short-term borrowings ..................... (29,884) (24,483) (34,200)
Other, net ........................................ (19,115) (8,750) (4,300)
Net cash provided by financing activities ............. 437,250 789,136 657,214
(DECREASE) INCREASE IN CASH AND CASH EQUIVALENTS . (84,078) 88,393 (5,970)
Cash and cash equivalents at beginning of period ............. 102,795 14,402 20,372
Cash and cash equivalents at end of period .................. $ 18,717 $ 102,795 $ 14,402
See accompanying notes to consolidated financial statements.
50