JetBlue Airlines 2004 Annual Report Download - page 47
Download and view the complete annual report
Please find page 47 of the 2004 JetBlue Airlines annual report below. You can navigate through the pages in the report by either clicking on the pages listed below, or by using the keyword search tool below to find specific information within the annual report.-
 1
1 -
2
-
3
-
4
-
5
-
6
-
7
-
8
-
9
-
10
-
11
-
12
-
13
-
14
-
15
-
16
-
17
-
18
-
19
-
20
-
21
-
22
-
23
-
24
-
25
-
26
-
27
-
28
-
29
-
30
-
31
-
32
-
33
-
34
-
35
-
36
-
 37
37 -
 38
38 -
 39
39 -
 40
40 -
 41
41 -
 42
42 -
 43
43 -
 44
44 -
 45
45 -
 46
46 -
 47
47 -
 48
48 -
 49
49 -
 50
50 -
 51
51 -
 52
52 -
 53
53 -
 54
54 -
 55
55 -
 56
56 -
 57
57 -
58
-
59
-
60
-
61
-
62
-
63
-
64
-
65
-
66
-
67
-
68
-
69
-
70
-
71
-
72
-
73
-
74
-
75
-
76
-
77
-
78
-
79
-
80
-
81
-
82
-
83
-
84
-
85
-
86
-
87
-
88
-
89
-
90
-
91
-
92
-
93
-
94
-
95
-
96
-
97
-
98
-
99
-
100
-
101
-
102
-
103
-
104
-
105
-
106
-
107
-
108
 |
 |
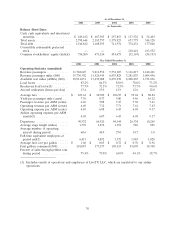
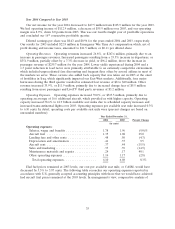
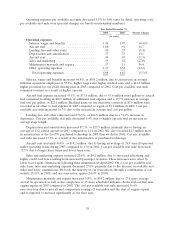
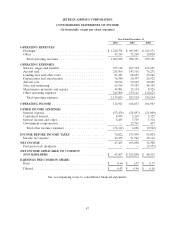
Other operating expenses increased 25.5%, or $32.3 million, primarily due to higher variable costs
associated with increased capacity and number of passengers served. Cost per available seat mile
decreased 24.2% as a result of our fixed costs being spread over higher capacity, better bad debt
experience and the consolidation of LiveTV’s operations in 2003.
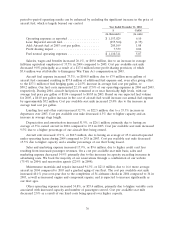
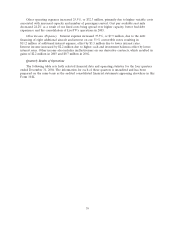
Other Income (Expense). Interest expense increased 37.5%, or $7.9 million, due to the debt
financing of eight additional aircraft and interest on our 31⁄2% convertible notes resulting in
$11.2 million of additional interest expense, offset by $3.3 million due to lower interest rates.
Interest income increased by $2.2 million due to higher cash and investment balances offset by lower
interest rates. Other income also includes ineffectiveness on our derivative contracts, which resulted in
gains of $2.2 million in 2003 and $0.7 million in 2002.
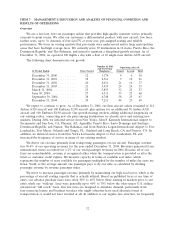
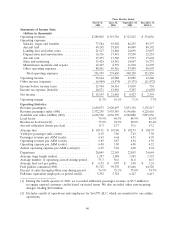
Quarterly Results of Operations
The following table sets forth selected financial data and operating statistics for the four quarters
ended December 31, 2004. The information for each of these quarters is unaudited and has been
prepared on the same basis as the audited consolidated financial statements appearing elsewhere in this
Form 10-K.
39