JetBlue Airlines 2004 Annual Report Download - page 45
Download and view the complete annual report
Please find page 45 of the 2004 JetBlue Airlines annual report below. You can navigate through the pages in the report by either clicking on the pages listed below, or by using the keyword search tool below to find specific information within the annual report.-
 1
1 -
2
-
3
-
4
-
5
-
6
-
7
-
8
-
9
-
10
-
11
-
12
-
13
-
14
-
15
-
16
-
17
-
18
-
19
-
20
-
21
-
22
-
23
-
24
-
25
-
26
-
27
-
28
-
29
-
30
-
31
-
32
-
33
-
34
-
 35
35 -
 36
36 -
 37
37 -
 38
38 -
 39
39 -
 40
40 -
 41
41 -
 42
42 -
 43
43 -
 44
44 -
 45
45 -
 46
46 -
 47
47 -
 48
48 -
 49
49 -
 50
50 -
 51
51 -
 52
52 -
 53
53 -
 54
54 -
 55
55 -
56
-
57
-
58
-
59
-
60
-
61
-
62
-
63
-
64
-
65
-
66
-
67
-
68
-
69
-
70
-
71
-
72
-
73
-
74
-
75
-
76
-
77
-
78
-
79
-
80
-
81
-
82
-
83
-
84
-
85
-
86
-
87
-
88
-
89
-
90
-
91
-
92
-
93
-
94
-
95
-
96
-
97
-
98
-
99
-
100
-
101
-
102
-
103
-
104
-
105
-
106
-
107
-
108
 |
 |
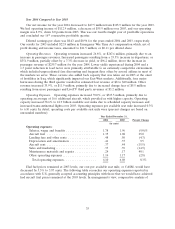
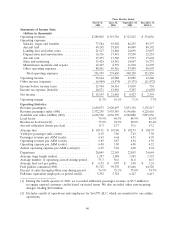
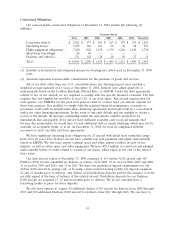
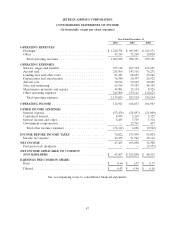
Other Income (Expense). Interest expense increased 85.1% primarily due to our debt financing of
15 additional aircraft and interest on our 31⁄2% convertible notes, resulting in $24.6 million of additional
interest expense. Interest income increased by $3.2 million due to higher interest rates. Other
income also includes the ineffective gains(losses) on our derivative contracts, which were de minimis in
2004 and resulted in a gain of $2.2 million in 2003.
Our effective tax rate declined to 38.2% in 2004 compared to 40.8% in 2003 primarily as a result
of $2.2 million in California State Enterprise Zone tax credits in 2004.
Year 2003 Compared to Year 2002
Our net income for the year 2003 increased to $103.9 million from $54.9 million for the year 2002.
We had operating income of $168.8 million, an increase of $63.8 million over 2002, and our operating
margin was 16.9%, up 0.4 points from 2002. Our effective tax rate was 40.8% in 2003 compared to
42.2% in 2002. During 2003, we incurred additional amortization, depreciation and salaries and benefits
expense, which was offset by a reduction in other operating expenses where the expense for payments
by JetBlue under its long-term contractual agreement to LiveTV were previously recorded.
Diluted earnings per share was $0.96 and $0.56 for the years ended 2003 and 2002, respectively.
Our results for 2003 included $22.8 million in Emergency War Time Act compensation which, net of
income taxes and profit sharing, amounted to $11.5 million, or $0.11 per diluted share. Our earnings
per share for 2003 reflect an increased number of weighted average shares outstanding compared to
2002 as a result of our capital raising efforts, including our follow-on public offering of common stock
in July 2003.
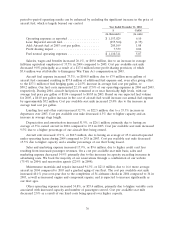
Operating Revenues. Operating revenues increased 57.2%, or $363.2 million, primarily due to an
increase in passenger revenues. Increased passengers resulting from a 51.6% increase in departures and
a 1.5 point increase in load factor, or $422.1 million, partially offset by a 7.0% decrease in yield, or
$72.2 million, drove the increase in passenger revenue of $349.9 million for the year 2003. Other
revenue increased 66.1%, or $13.3 million, primarily due to increased change fees of $6.5 million
resulting from more passengers, LiveTV third party revenues of $3.2 million and concession sales from
Terminal 6 at JFK of $1.2 million.
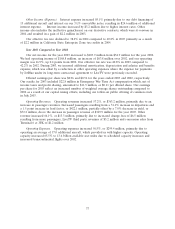
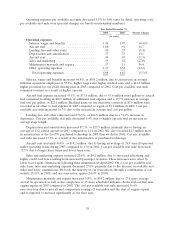
Operating Expenses. Operating expenses increased 56.5%, or $299.4 million, primarily due to
operating an average of 17.0 additional aircraft, which provided us with higher capacity. Operating
capacity increased 65.5% to 13.6 billion available seat miles due to scheduled capacity increases and
increased transcontinental flights over 2002.
37