JetBlue Airlines 2003 Annual Report Download - page 67
Download and view the complete annual report
Please find page 67 of the 2003 JetBlue Airlines annual report below. You can navigate through the pages in the report by either clicking on the pages listed below, or by using the keyword search tool below to find specific information within the annual report.-
 1
1 -
2
-
3
-
4
-
5
-
6
-
7
-
8
-
9
-
10
-
11
-
12
-
13
-
14
-
15
-
16
-
17
-
18
-
19
-
20
-
21
-
22
-
23
-
24
-
25
-
26
-
27
-
28
-
29
-
30
-
31
-
32
-
33
-
34
-
35
-
36
-
37
-
38
-
39
-
40
-
41
-
42
-
43
-
44
-
45
-
46
-
47
-
48
-
49
-
50
-
51
-
52
-
53
-
54
-
55
-
56
-
 57
57 -
 58
58 -
 59
59 -
 60
60 -
 61
61 -
 62
62 -
 63
63 -
 64
64 -
 65
65 -
 66
66 -
 67
67 -
 68
68 -
 69
69 -
 70
70 -
 71
71 -
 72
72 -
 73
73 -
 74
74 -
 75
75 -
 76
76 -
 77
77 -
78
-
79
-
80
-
81
-
82
-
83
-
84
-
85
-
86
-
87
-
88
-
89
 |
 |

JETBLUE AIRWAYS CORPORATION
NOTES TO CONSOLIDATED FINANCIAL STATEMENTS (Continued)
December 31, 2003
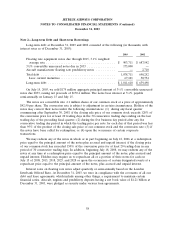
Note 7—Stock-Based Compensation (Continued)
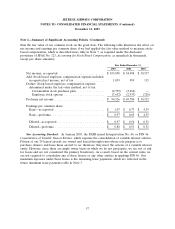
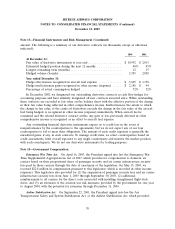
The following is a summary of outstanding stock options at December 31, 2003:
Options Outstanding Options Vested
Weighted-Average Weighted- Weighted-
Remaining Average Average
Contractual Life Exercise Exercise
Shares (years) Price Shares Price
Range of exercise prices
$0.49 to $1.09 .................... 3,203,380 6.1 $ 0.67 1,855,317 $ 0.58
$1.31 to $2.56 .................... 3,036,619 7.5 2.27 452,494 2.22
$6.00 to $14.53 ................... 2,418,465 8.4 9.99 317,678 9.29
$17.03 to $19.94 .................. 4,190,863 8.9 18.39 266,113 18.25
$21.22 to $44.57 .................. 3,303,685 9.3 30.55 80,035 21.23
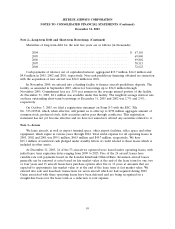
Certain options granted prior to our initial public offering had exercise prices that were less than
the deemed market value of the underlying common stock at the date of grant. Unearned
compensation expense associated with these transactions is being amortized on a straight-line basis over
the vesting periods of five or seven years and will be $1.8 million per year in 2004 through 2006,
$1.1 million in 2007 and $1.0 million in 2008. The following table discloses the number of options
granted and certain weighted-average information of options granted:
Number of Options Fair Value Exercise Price
Exercise price equals market price:
2003 ................................ 4,054,875 $ 12.94 $ 27.71
2002 ................................ 5,204,250 8.50 17.43
2001 ................................ 1,014,750 0.41 1.61
Exercise price less than market price:
2002 ................................ 1,284,535 8.16 6.00
2001 ................................ 2,569,500 1.95 2.56
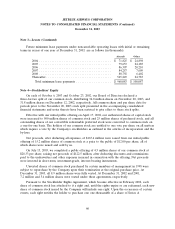
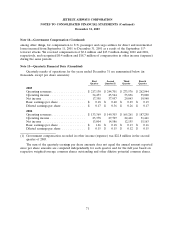
The fair value of each option is estimated on the date of grant using the Black-Scholes option
pricing model. The following table shows our assumptions and weighted average fair values of stock-
based compensation used to compute the proforma information for employee stock options included in
Note 1:
Year of Grant
2003 2002 2001
Risk-free interest rate ................................. 3.5% 4.2% 4.9%
Average expected life of options (years) ................... 6.3 6.4 6.4
Expected volatility of common stock ...................... 41.5% 41.3% 0.0%
Weighted average fair value of stock options ................ $ 12.94 $ 8.43 $ 1.51
Because the Company’s stock options have characteristics significantly different from those of
traded options and because changes in the subjective input assumptions can materially affect the fair
value estimate, in management’s opinion, the existing models for valuing options do not necessarily
provide a reliable single measure of their fair values.
64