JetBlue Airlines 2003 Annual Report Download - page 36
Download and view the complete annual report
Please find page 36 of the 2003 JetBlue Airlines annual report below. You can navigate through the pages in the report by either clicking on the pages listed below, or by using the keyword search tool below to find specific information within the annual report.-
 1
1 -
2
-
3
-
4
-
5
-
6
-
7
-
8
-
9
-
10
-
11
-
12
-
13
-
14
-
15
-
16
-
17
-
18
-
19
-
20
-
21
-
22
-
23
-
24
-
25
-
 26
26 -
 27
27 -
 28
28 -
 29
29 -
 30
30 -
 31
31 -
 32
32 -
 33
33 -
 34
34 -
 35
35 -
 36
36 -
 37
37 -
 38
38 -
 39
39 -
 40
40 -
 41
41 -
 42
42 -
 43
43 -
 44
44 -
 45
45 -
 46
46 -
47
-
48
-
49
-
50
-
51
-
52
-
53
-
54
-
55
-
56
-
57
-
58
-
59
-
60
-
61
-
62
-
63
-
64
-
65
-
66
-
67
-
68
-
69
-
70
-
71
-
72
-
73
-
74
-
75
-
76
-
77
-
78
-
79
-
80
-
81
-
82
-
83
-
84
-
85
-
86
-
87
-
88
-
89
 |
 |

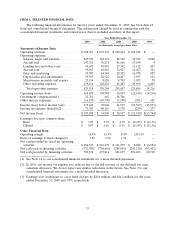
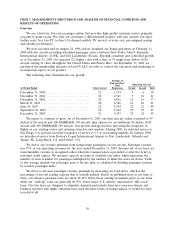
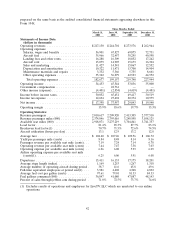
ITEM 6. SELECTED FINANCIAL DATA
The following financial information for the five years ended December 31, 2003, has been derived
from our consolidated financial statements. This information should be read in conjunction with the
consolidated financial statements and related notes thereto included elsewhere in this report.
Year Ended December 31,
2003 2002 2001 2000 1999
(in thousands, except per share data)
Statements of Income Data:
Operating revenues .................. $998,351 $ 635,191 $ 320,414 $ 104,618 $ —
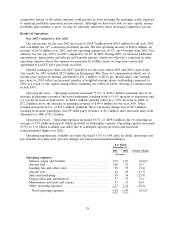
Operating expenses:
Salaries, wages and benefits .......... 267,334 162,191 84,762 32,912 6,000
Aircraft fuel ...................... 147,316 76,271 41,666 17,634 4
Landing fees and other rents ......... 68,691 43,881 27,342 11,112 447
Aircraft rent ..................... 59,963 40,845 32,927 13,027 324
Sales and marketing ................ 53,587 44,345 28,305 16,978 887
Depreciation and amortization ........ 50,397 26,922 10,417 3,995 111
Maintenance materials and repairs ..... 23,114 8,926 4,705 1,052 38
Other operating expenses ............ 159,116 126,823 63,483 29,096 6,405
Total operating expenses ........... 829,518 530,204 293,607 125,806 14,216
Operating income (loss) ............... 168,833 104,987 26,807 (21,188) (14,216)
Government compensation(1) ........... 22,761 407 18,706 — —
Other income (expense) ............... (16,155) (10,370) (3,598) (381) 685
Income (loss) before income taxes ....... 175,439 95,024 41,915 (21,569) (13,531)
Income tax expense (benefit)(2) ......... 71,541 40,116 3,378 (239) 233
Net income (loss) ................... $103,898 $ 54,908 $ 38,537 $ (21,330) $(13,764)
Earnings (loss) per common share:
Basic ........................... $ 1.07 $ 0.73 $ 4.39 $ (11.85) $ (16.36)
Diluted ......................... $ 0.97 $ 0.56 $ 0.51 $ (11.85) $ (16.36)
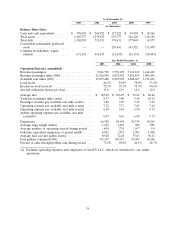
Other Financial Data:
Operating margin ................... 16.9% 16.5% 8.4% (20.3)% —
Ratio of earnings to fixed charges(3) ..... 3.2x 2.7x 1.9x — —
Net cash provided by (used in) operating
activities ........................ $286,337 $ 216,477 $ 111,279 $ 2,824 $ (6,556)
Net cash used in investing activities ...... (751,530) (744,461) (289,855) (241,130) (67,452)
Net cash provided by financing activities . . . 789,136 657,214 261,695 254,463 80,740
(1) See Note 14 to our consolidated financial statements for a more detailed discussion.
(2) In 2001, our income tax expense was reduced due to the full reversal of our deferred tax asset
valuation allowance. We do not expect any similar reductions in the future. See Note 9 to our
consolidated financial statements for a more detailed discussion.
(3) Earnings were inadequate to cover fixed charges by $26.0 million and $14.2 million for the years
ended December 31, 2000 and 1999, respectively.
33