JetBlue Airlines 2003 Annual Report Download - page 38
Download and view the complete annual report
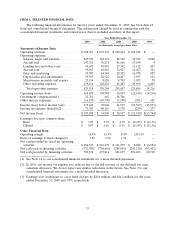
Please find page 38 of the 2003 JetBlue Airlines annual report below. You can navigate through the pages in the report by either clicking on the pages listed below, or by using the keyword search tool below to find specific information within the annual report.-
 1
1 -
2
-
3
-
4
-
5
-
6
-
7
-
8
-
9
-
10
-
11
-
12
-
13
-
14
-
15
-
16
-
17
-
18
-
19
-
20
-
21
-
22
-
23
-
24
-
25
-
26
-
27
-
 28
28 -
 29
29 -
 30
30 -
 31
31 -
 32
32 -
 33
33 -
 34
34 -
 35
35 -
 36
36 -
 37
37 -
 38
38 -
 39
39 -
 40
40 -
 41
41 -
 42
42 -
 43
43 -
 44
44 -
 45
45 -
 46
46 -
 47
47 -
 48
48 -
49
-
50
-
51
-
52
-
53
-
54
-
55
-
56
-
57
-
58
-
59
-
60
-
61
-
62
-
63
-
64
-
65
-
66
-
67
-
68
-
69
-
70
-
71
-
72
-
73
-
74
-
75
-
76
-
77
-
78
-
79
-
80
-
81
-
82
-
83
-
84
-
85
-
86
-
87
-
88
-
89
 |
 |
The following terms used in this section and elsewhere in this report have the meanings indicated
below:
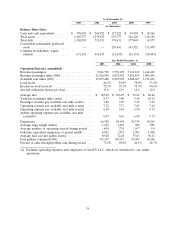
‘‘Revenue passengers’’ represents the total number of paying passengers flown on all flight
segments.
‘‘Revenue passenger miles’’ represents the number of miles flown by revenue passengers.
‘‘Available seat miles’’ represents the number of seats available for passengers multiplied by the
number of miles the seats are flown.
‘‘Load factor’’ represents the percentage of aircraft seating capacity that is actually utilized
(revenue passenger miles divided by available seat miles).
‘‘Breakeven load factor’’ is the passenger load factor that will result in operating revenues
being equal to operating expenses, assuming constant revenue per passenger mile and
expenses.
‘‘Aircraft utilization’’ represents the average number of block hours operated per day per
aircraft for the total fleet of aircraft.
‘‘Average fare’’ represents the average one-way fare paid per flight segment by a revenue
passenger.
‘‘Yield per passenger mile’’ represents the average amount one passenger pays to fly one mile.
‘‘Passenger revenue per available seat mile’’ represents passenger revenue divided by available
seat miles.
‘‘Operating revenue per available seat mile’’ represents operating revenues divided by available
seat miles.
‘‘Operating expense per available seat mile’’ represents operating expenses divided by available
seat miles.
‘‘Average stage length’’ represents the average number of miles flown per flight.
35