JetBlue Airlines 2003 Annual Report Download - page 41
Download and view the complete annual report
Please find page 41 of the 2003 JetBlue Airlines annual report below. You can navigate through the pages in the report by either clicking on the pages listed below, or by using the keyword search tool below to find specific information within the annual report.-
 1
1 -
2
-
3
-
4
-
5
-
6
-
7
-
8
-
9
-
10
-
11
-
12
-
13
-
14
-
15
-
16
-
17
-
18
-
19
-
20
-
21
-
22
-
23
-
24
-
25
-
26
-
27
-
28
-
29
-
30
-
 31
31 -
 32
32 -
 33
33 -
 34
34 -
 35
35 -
 36
36 -
 37
37 -
 38
38 -
 39
39 -
 40
40 -
 41
41 -
 42
42 -
 43
43 -
 44
44 -
 45
45 -
 46
46 -
 47
47 -
 48
48 -
 49
49 -
 50
50 -
 51
51 -
52
-
53
-
54
-
55
-
56
-
57
-
58
-
59
-
60
-
61
-
62
-
63
-
64
-
65
-
66
-
67
-
68
-
69
-
70
-
71
-
72
-
73
-
74
-
75
-
76
-
77
-
78
-
79
-
80
-
81
-
82
-
83
-
84
-
85
-
86
-
87
-
88
-
89
 |
 |

competitive nature of the airline industry could prevent us from attaining the passenger traffic required
to maintain profitable operations in new markets. Although we have been able to raise capital, remain
profitable and continue to grow, we may be adversely affected by these increased competitive actions.
Results of Operations
Year 2003 Compared to Year 2002
Our net income for the year 2003 increased to $103.9 million from $54.9 million for the year 2002
and concluded our 12th consecutive profitable quarter. We had operating income of $168.8 million, an
increase of $63.8 million over 2002, and our operating margin was 16.9%, up 0.4 points from 2002. Our
effective tax rate was 40.8% in 2003 compared to 42.2% in 2002. During 2003, we incurred additional
amortization, depreciation and salaries and benefits expense, which was offset by a reduction in other
operating expenses where the expense for payments by JetBlue under its long-term contractual
agreement to LiveTV were previously recorded.
Diluted earnings per share was $0.97 and $0.56 for the years ended 2003 and 2002, respectively.
Our results for 2003 included $22.8 million in Emergency War Time Act compensation which, net of
income taxes and profit sharing, amounted to $11.5 million, or $0.11 per diluted share. Our earnings
per share for 2003 reflect an increased number of weighted average shares outstanding compared to
2002 as a result of our capital raising efforts, including our follow-on public offering of common stock
in July 2003.
Operating Revenues. Operating revenues increased 57.2%, or $363.2 million, primarily due to an
increase in passenger revenues. Increased passengers resulting from a 51.6% increase in departures and
a 1.5 point increase in load factor, or $422.1 million, partially offset by a 7.0% decrease in yield, or
$72.2 million, drove the increase in passenger revenue of $349.9 million for the year 2003. Other
revenue increased 66.1%, or $13.3 million, primarily due to increased change fees of $6.5 million
resulting from more passengers, LiveTV third party revenues of $3.2 million and concession sales from
Terminal 6 at JFK of $1.2 million.
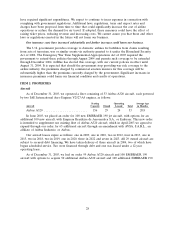
Operating Expenses. Operating expenses increased 56.5%, or $299.4 million, due to operating an
average of 17.0 additional aircraft, which provided us with higher capacity. Operating capacity increased
65.5% to 13.6 billion available seat miles due to scheduled capacity increases and increased
transcontinental flights over 2002.
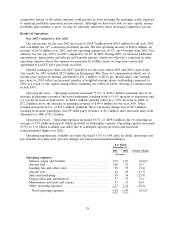
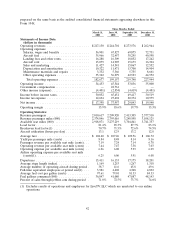
Operating expenses per available seat mile decreased 5.5% to 6.08 cents. In detail, operating costs
per available seat mile were (percent changes are based on unrounded numbers):
Year Ended
December 31,
2003 2002 Percent Change
(in cents)
Operating expenses:
Salaries, wages and benefits ........................ 1.96 1.97 (0.4)%
Aircraft fuel ................................... 1.08 .92 16.7
Landing fees and other rents ....................... .50 .53 (5.4)
Aircraft rent ................................... .44 .49 (11.3)
Sales and marketing .............................. .39 .54 (27.0)
Depreciation and amortization ...................... .37 .33 13.1
Maintenance materials and repairs ................... .17 .11 56.4
Other operating expenses .......................... 1.17 1.54 (24.2)
Total operating expenses ......................... 6.08 6.43 (5.5)%
38