JetBlue Airlines 2003 Annual Report Download - page 45
Download and view the complete annual report
Please find page 45 of the 2003 JetBlue Airlines annual report below. You can navigate through the pages in the report by either clicking on the pages listed below, or by using the keyword search tool below to find specific information within the annual report.-
 1
1 -
2
-
3
-
4
-
5
-
6
-
7
-
8
-
9
-
10
-
11
-
12
-
13
-
14
-
15
-
16
-
17
-
18
-
19
-
20
-
21
-
22
-
23
-
24
-
25
-
26
-
27
-
28
-
29
-
30
-
31
-
32
-
33
-
34
-
 35
35 -
 36
36 -
 37
37 -
 38
38 -
 39
39 -
 40
40 -
 41
41 -
 42
42 -
 43
43 -
 44
44 -
 45
45 -
 46
46 -
 47
47 -
 48
48 -
 49
49 -
 50
50 -
 51
51 -
 52
52 -
 53
53 -
 54
54 -
 55
55 -
56
-
57
-
58
-
59
-
60
-
61
-
62
-
63
-
64
-
65
-
66
-
67
-
68
-
69
-
70
-
71
-
72
-
73
-
74
-
75
-
76
-
77
-
78
-
79
-
80
-
81
-
82
-
83
-
84
-
85
-
86
-
87
-
88
-
89
 |
 |

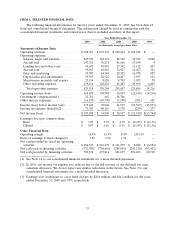
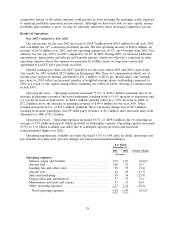
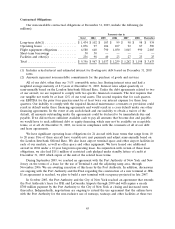
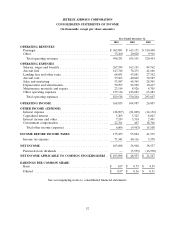
prepared on the same basis as the audited consolidated financial statements appearing elsewhere in this
Form 10-K.
Three Months Ended
March 31, June 30, September 30, December 31,
2003 2003 2003 2003
Statements of Income Data
(dollars in thousands)
Operating revenues ........................ $217,130 $ 244,701 $ 273,576 $ 262,944
Operating expenses:
Salaries, wages and benefits ................ 56,901 67,827 69,875 72,731
Aircraft fuel ............................ 35,966 32,457 38,295 40,598
Landing fees and other rents ................ 16,288 16,309 18,852 17,242
Aircraft rent ........................... 13,079 14,907 15,673 16,304
Sales and marketing ...................... 11,427 14,541 15,067 12,552
Depreciation and amortization .............. 10,322 11,471 13,700 14,904
Maintenance materials and repairs ........... 3,332 5,366 5,755 8,661
Other operating expenses .................. 35,362 36,279 42,523 44,952
Total operating expenses ................. 182,677 199,157 219,740 227,944
Operating income ......................... 34,453 45,544 53,836 35,000
Government compensation ................... — 22,761 — —
Other income (expense) ..................... (4,401) (2,854) (4,419) (4,481)
Income before income taxes .................. 30,052 65,451 49,417 30,519
Income tax expense ........................ 12,694 27,494 20,374 10,979
Net income .............................. $ 17,358 $ 37,957 $ 29,043 $ 19,540
Operating margin ......................... 15.9% 18.6% 19.7% 13.3%
Operating Statistics:
Revenue passengers ........................ 2,010,617 2,209,920 2,413,505 2,377,510
Revenue passenger miles (000) ................ 2,374,846 2,795,016 3,248,958 3,108,125
Available seat miles (000) ................... 2,918,071 3,275,219 3,704,841 3,741,357
Load factor .............................. 81.4% 85.3% 87.7% 83.1%
Breakeven load factor(1) .................... 70.7% 71.5% 72.6% 74.5%
Aircraft utilization (hours per day) ............. 13.1 12.9 13.2 12.8
Average fare ............................. $ 104.40 $ 107.26 $ 109.56 $ 106.72
Yield per passenger mile (cents) ............... 8.84 8.48 8.14 8.16
Passenger revenue per available seat mile (cents) . . . 7.19 7.24 7.14 6.78
Operating revenue per available seat mile (cents) . . 7.44 7.47 7.38 7.03
Operating expense per available seat mile (cents) . . 6.26 6.08 5.93 6.09
Airline operating expense per available seat mile
(cents)(1) .............................. 6.25 6.06 5.91 6.08
Departures .............................. 15,411 16,133 17,175 18,201
Average stage length (miles) .................. 1,169 1,253 1,267 1,318
Average number of operating aircraft during period . 38.7 41.6 45.8 49.6
Full-time equivalent employees at period end(1) . . . 3,981 4,402 4,548 4,892
Average fuel cost per gallon (cents) ............ 97.61 79.01 81.33 84.33
Fuel gallons consumed (000) ................. 36,847 41,080 47,087 48,143
Percent of sales through jetblue.com during period . 71.0% 72.5% 73.7% 74.6%
(1) Excludes results of operations and employees for LiveTV, LLC which are unrelated to our airline
operations.
42