JetBlue Airlines 2003 Annual Report Download - page 44
Download and view the complete annual report
Please find page 44 of the 2003 JetBlue Airlines annual report below. You can navigate through the pages in the report by either clicking on the pages listed below, or by using the keyword search tool below to find specific information within the annual report.-
 1
1 -
2
-
3
-
4
-
5
-
6
-
7
-
8
-
9
-
10
-
11
-
12
-
13
-
14
-
15
-
16
-
17
-
18
-
19
-
20
-
21
-
22
-
23
-
24
-
25
-
26
-
27
-
28
-
29
-
30
-
31
-
32
-
33
-
 34
34 -
 35
35 -
 36
36 -
 37
37 -
 38
38 -
 39
39 -
 40
40 -
 41
41 -
 42
42 -
 43
43 -
 44
44 -
 45
45 -
 46
46 -
 47
47 -
 48
48 -
 49
49 -
 50
50 -
 51
51 -
 52
52 -
 53
53 -
 54
54 -
55
-
56
-
57
-
58
-
59
-
60
-
61
-
62
-
63
-
64
-
65
-
66
-
67
-
68
-
69
-
70
-
71
-
72
-
73
-
74
-
75
-
76
-
77
-
78
-
79
-
80
-
81
-
82
-
83
-
84
-
85
-
86
-
87
-
88
-
89
 |
 |
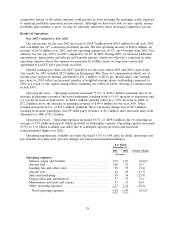
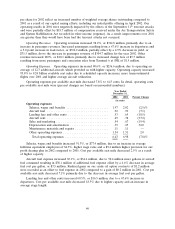
Aircraft rent increased 24.0%, or $7.9 million, due to having an average of 13 aircraft operated
under operating leases during the 2002 compared to 10 in 2001. Cost per available seat mile decreased
37.2% due to a lower percentage of the aircraft fleet being leased.
Sales and marketing expense increased 56.7%, or $16.1 million, due to increased advertising and
higher credit card fees resulting from increased passenger revenues. These increases were offset by
lower travel agent commissions following their elimination in April 2002. On a cost per available seat
mile basis, sales and marketing expense decreased 19.4% primarily due to the increase in available seat
miles and lower commissions. We book the majority of our reservations through a combination of our
website (63.0% in 2002) and our own reservation agents (33.3% in 2002).
Depreciation and amortization increased 158%, or $16.5 million, primarily due to having an
average of 14 owned aircraft in 2002 compared to five in 2001. In addition, 2002 includes depreciation
and amortization related to the acquired LiveTV assets of $1.3 million. Cost per available seat mile
increased 32.0% as a result of a greater percentage of our fleet being owned.
Maintenance materials and repairs increased 89.7%, or $4.2 million, due to 12.3 more average
aircraft in operation as well as 11 more scheduled airframe checks in 2002 compared to 2001. The cost
per available seat mile remained constant year-over-year.
Other operating expenses increased 99.8%, or $63.4 million. Higher variable costs associated with
increased capacity and number of passengers served was the primary reason for the increase.
Additionally, insurance premiums, primarily those related to our war risk insurance, increased 241% or
$11.8 million in 2002. Other operating costs for our terminal at JFK increased $11.4 million to
$12.5 million in 2002 as a result of operating the terminal for the entire year. Cost per available seat
mile increased 2.0%.
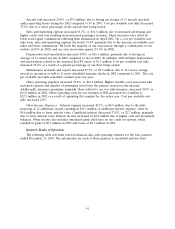
Other Income (Expense). Interest expense increased 48.7%, or $6.9 million, due to the debt
financing of 12 additional aircraft resulting in $11.3 million of additional interest expense, offset by
$4.4 million due to lower interest rates. Capitalized interest decreased 33.8%, or $2.7 million, primarily
due to lower interest rates. Interest income increased by $2.0 million due to higher cash and investment
balances. Other income also includes unrealized gains and losses on our crude oil options, which
resulted in gains of $0.7 million in 2002 and losses of $0.1 million in 2001.
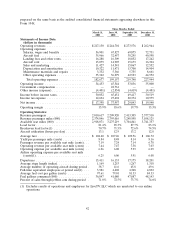
Quarterly Results of Operations
The following table sets forth selected financial data and operating statistics for the four quarters
ended December 31, 2003. The information for each of these quarters is unaudited and has been
41