JetBlue Airlines 2003 Annual Report Download - page 53
Download and view the complete annual report
Please find page 53 of the 2003 JetBlue Airlines annual report below. You can navigate through the pages in the report by either clicking on the pages listed below, or by using the keyword search tool below to find specific information within the annual report.-
 1
1 -
2
-
3
-
4
-
5
-
6
-
7
-
8
-
9
-
10
-
11
-
12
-
13
-
14
-
15
-
16
-
17
-
18
-
19
-
20
-
21
-
22
-
23
-
24
-
25
-
26
-
27
-
28
-
29
-
30
-
31
-
32
-
33
-
34
-
35
-
36
-
37
-
38
-
39
-
40
-
41
-
42
-
 43
43 -
 44
44 -
 45
45 -
 46
46 -
 47
47 -
 48
48 -
 49
49 -
 50
50 -
 51
51 -
 52
52 -
 53
53 -
 54
54 -
 55
55 -
 56
56 -
 57
57 -
 58
58 -
 59
59 -
 60
60 -
 61
61 -
 62
62 -
 63
63 -
64
-
65
-
66
-
67
-
68
-
69
-
70
-
71
-
72
-
73
-
74
-
75
-
76
-
77
-
78
-
79
-
80
-
81
-
82
-
83
-
84
-
85
-
86
-
87
-
88
-
89
 |
 |

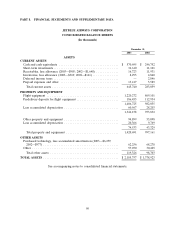
PART 8. FINANCIAL STATEMENTS AND SUPPLEMENTARY DATA
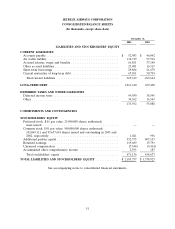
JETBLUE AIRWAYS CORPORATION
CONSOLIDATED BALANCE SHEETS
(In thousands)
December 31,
2003 2002
ASSETS
CURRENT ASSETS
Cash and cash equivalents .................................. $ 570,695 $ 246,752
Short-term investments ..................................... 36,610 11,101
Receivables, less allowance (2003—$903; 2002—$1,648) ............. 16,723 11,931
Inventories, less allowance (2003—$369; 2002—$161) ............... 8,295 4,840
Deferred income taxes ..................................... — 2,846
Prepaid expenses and other ................................. 13,417 5,589
Total current assets ...................................... 645,740 283,059
PROPERTY AND EQUIPMENT
Flight equipment ......................................... 1,220,272 869,101
Predelivery deposits for flight equipment ........................ 186,453 112,934
1,406,725 982,035
Less accumulated depreciation ............................... 60,567 28,203
1,346,158 953,832
Other property and equipment ............................... 94,899 53,098
Less accumulated depreciation ............................... 20,366 9,769
74,533 43,329
Total property and equipment .............................. 1,420,691 997,161
OTHER ASSETS
Purchased technology, less accumulated amortization (2003—$6,259;
2002—$977) ........................................... 62,256 68,278
Other ................................................. 57,070 30,425
Total other assets ....................................... 119,326 98,703
TOTAL ASSETS ........................................... $ 2,185,757 $ 1,378,923
See accompanying notes to consolidated financial statements.
50