JetBlue Airlines 2003 Annual Report Download - page 43
Download and view the complete annual report
Please find page 43 of the 2003 JetBlue Airlines annual report below. You can navigate through the pages in the report by either clicking on the pages listed below, or by using the keyword search tool below to find specific information within the annual report.-
 1
1 -
2
-
3
-
4
-
5
-
6
-
7
-
8
-
9
-
10
-
11
-
12
-
13
-
14
-
15
-
16
-
17
-
18
-
19
-
20
-
21
-
22
-
23
-
24
-
25
-
26
-
27
-
28
-
29
-
30
-
31
-
32
-
 33
33 -
 34
34 -
 35
35 -
 36
36 -
 37
37 -
 38
38 -
 39
39 -
 40
40 -
 41
41 -
 42
42 -
 43
43 -
 44
44 -
 45
45 -
 46
46 -
 47
47 -
 48
48 -
 49
49 -
 50
50 -
 51
51 -
 52
52 -
 53
53 -
54
-
55
-
56
-
57
-
58
-
59
-
60
-
61
-
62
-
63
-
64
-
65
-
66
-
67
-
68
-
69
-
70
-
71
-
72
-
73
-
74
-
75
-
76
-
77
-
78
-
79
-
80
-
81
-
82
-
83
-
84
-
85
-
86
-
87
-
88
-
89
 |
 |

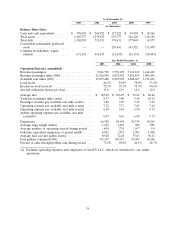
per share for 2002 reflect an increased number of weighted average shares outstanding compared to
2001 as a result of our capital raising efforts, including our initial public offering in April 2002. Our
operating results in 2001 were negatively impacted by the effects of the September 11th terrorist attacks
and were partially offset by $18.7 million of compensation received under the Air Transportation Safety
and System Stablilization Act recorded in other income (expense). As a result, improvements over 2001
are greater than they would have been had the terrorist attacks not occurred.
Operating Revenues. Operating revenues increased 98.2%, or $314.8 million, primarily due to an
increase in passenger revenues. Increased passengers resulting from a 67.6% increase in departures and
a 5.0 point increase in load factor, or $336.2 million, partially offset by a 4.9% decrease in yield, or
$31.5 million, drove the increase in passenger revenue of $304.7 million for the year 2002. Other
revenue increased 102%, or $10.1 million, primarily due to increased change fees of $5.7 million
resulting from more passengers and concession sales from Terminal 6 at JFK of $1.5 million.
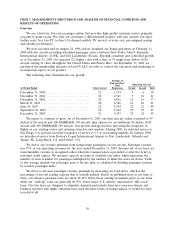
Operating Expenses. Operating expenses increased 80.6%, or $236.6 million, due to operating an
average of 12.3 additional aircraft, which provided us with higher capacity. Operating capacity increased
95.8% to 8.24 billion available seat miles due to scheduled capacity increases, more transcontinental
flights over 2001 and higher average aircraft utilization.
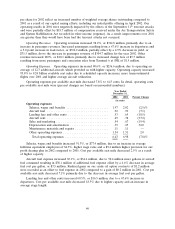
Operating expenses per available seat mile decreased 7.8% to 6.43 cents. In detail, operating costs
per available seat mile were (percent changes are based on unrounded numbers):
Year Ended
December 31,
2002 2001 Percent Change
(in cents)
Operating expenses:
Salaries, wages and benefits ........................ 1.97 2.02 (2.5)%
Aircraft fuel ................................... .92 .99 (7.1)
Landing fees and other rents ....................... .53 .65 (18.5)
Aircraft rent ................................... .49 .78 (37.2)
Sales and marketing .............................. .54 .67 (19.4)
Depreciation and amortization ...................... .33 .25 32.0
Maintenance materials and repairs ................... .11 .11 —
Other operating expenses .......................... 1.54 1.51 2.0
Total operating expenses ......................... 6.43 6.98 (7.8)%
Salaries, wages and benefits increased 91.3%, or $77.4 million, due to an increase in average
full-time equivalent employees of 84.3%, higher wage rates and a $9.4 million higher provision for our
profit sharing plan in 2002 compared to 2001. Cost per available seat mile decreased 2.5% as a result
of higher capacity.
Aircraft fuel expense increased 83.1%, or $34.6 million, due to 50.4 million more gallons of aircraft
fuel consumed resulting in $38.1 million of additional fuel expense offset by a 4.4% decrease in average
fuel cost per gallon, or $3.5 million. Realized gains on our crude oil option contracts of $1.2 million
were recorded as an offset to fuel expense in 2002 compared to a gain of $0.2 million in 2001. Cost per
available seat mile decreased 7.1% primarily due to the decrease in average fuel cost per gallon.
Landing fees and other rents increased 60.5%, or $16.5 million, due to a 67.6% increase in
departures. Cost per available seat mile decreased 18.5% due to higher capacity and an increase in
average stage length.
40