Hyundai 2005 Annual Report Download - page 59
Download and view the complete annual report
Please find page 59 of the 2005 Hyundai annual report below. You can navigate through the pages in the report by either clicking on the pages listed below, or by using the keyword search tool below to find specific information within the annual report.-
 1
1 -
2
-
3
-
4
-
5
-
6
-
7
-
8
-
9
-
10
-
11
-
12
-
13
-
14
-
15
-
16
-
17
-
18
-
19
-
20
-
21
-
22
-
23
-
24
-
25
-
26
-
27
-
28
-
29
-
30
-
31
-
32
-
33
-
34
-
35
-
36
-
37
-
38
-
39
-
40
-
41
-
42
-
43
-
44
-
45
-
46
-
47
-
48
-
 49
49 -
 50
50 -
 51
51 -
 52
52 -
 53
53 -
 54
54 -
 55
55 -
 56
56 -
 57
57 -
 58
58 -
 59
59 -
 60
60 -
 61
61 -
 62
62 -
 63
63
 |
 |
116
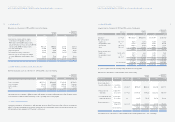
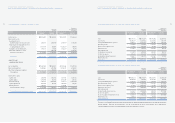
HYUNDAI MOTOR COMPANY AND SUBSIDIARIES
NOTES TO CONSOLIDATED FINANCIAL STATEMENTS FOR THE YEARS ENDED DECEMBER 31, 2005 AND 2004
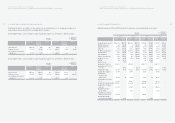
Consolidated Statement of Income for the year ended December 31, 2005
Non-financial Financial Non-financial Financial
industry industry industry industry
Sales ₩56,691,394 ₩2,734,437 $55,963,864 $2,699,346
Cost of sales 45,205,279 1,247,642 44,625,152 1,231,631
Selling and administrative expenses 9,278,617 1,379,111 9,159,543 1,361,413
Operating income 2,207,498 107,684 2,179,169 106,302
Other income (expenses), net 913,376 350,818 901,654 346,316
Ordinary income 3,120,874 458,502 3,080,823 452,618
Extraordinary item - - - -
Income before income tax 3,120,874 458,502 3,080,823 452,618
Income tax expense 570,457 (27,617) 563,136 (27,263)
Income before minority interests 2,550,417 486,119 2,517,687 479,881
Minority interests 359,908 - 355,289 -
Net income ₩2,190,509 ₩486,119 $2,162,398 $479,881
Korean Won
(In millions)
Translation into
U.S. Dollars (Note 2)
(In thousands)
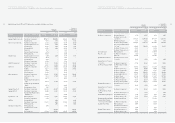
Consolidated Statement of Income for the year ended December 31, 2004
Non-financial Financial Non-financial Financial
industry industry industry industry
Sales ₩51,094,313 ₩2,267,519 $50,438,611 $2,238,420
Cost of sales 38,606,878 983,007 38,111,429 970,392
Selling and administrative expenses 9,730,792 1,660,632 9,605,915 1,639,321
Operating income (loss) 2,756,643 (376,120) 2,721,267 (371,293)
Other income (expenses), net 873,694 (204,260) 862,482 (201,639)
Ordinary income (loss) 3,630,337 (580,380) 3,583,748 (572,932)
Extraordinary item - - - -
Income (loss) before income tax 3,630,337 (580,380) 3,583,748 (572,932)
Income tax expense 1,072,996 24,843 1,059,226 24,524
Income (loss) before minority interests 2,557,341 (605,223) 2,524,522 (597,456)
Minority interests 400,536 - 395,396 -
Net income (loss) ₩2,156,805 ₩(605,223) $2,129,126 $(597,456)
The above consolidated financial statements by industry type are prepared independently between non-financial industry and
financial industry. Therefore, the total amounts, such as assets and net income for each industry, do not tally with the
corresponding amounts in the consolidated balance sheets and statements of income.
Korean Won
(In millions)
Translation into
U.S. Dollars (Note 2)
(In thousands)
115
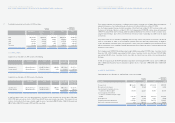
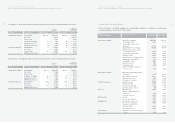
HYUNDAI MOTOR COMPANY AND SUBSIDIARIES
NOTES TO CONSOLIDATED FINANCIAL STATEMENTS FOR THE YEARS ENDED DECEMBER 31, 2005 AND 2004
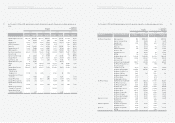
Consolidated Balance Sheet as of December 31, 2004
ASSETS Non-financial Financial Non-financial Financial
industry industry industry industry
Current assets: ₩20,504,959 ₩1,635,450 $20,241,815 $1,614,462
Non-current assets:
Investments, net of
unamortized present value discount 4,745,661 3,206,150 4,684,759 3,165,005
Property, plant and equipment, net of
accumulated depreciation 19,667,696 150,506 19,415,297 148,575
Intangibles, net of amortization 1,765,121 19,549 1,742,469 19,298
Other financial business assets - 7,813,618 - 7,713,344
Total non-current assets 26,178,478 11,189,823 25,842,525 11,046,222
Total assets ₩46,683,437 ₩12,825,273 $46,084,341 $12,660,684
LIABILITIES AND
SHAREHOLDERS’ EQUITY
Current liabilities ₩19,247,245 ₩7,498,007 $19,000,242 $7,401,784
Non-current liabilities 10,258,642 4,193,856 10,126,991 4,140,036
Other financial business liabilities - 108,843 - 107,446
Total liabilities 29,505,887 11,800,706 29,127,233 11,649,266
Shareholders’ equity:
Capital stock 1,480,752 1,653,342 1,461,749 1,632,124
Capital surplus 5,168,984 296,732 5,102,650 292,924
Retained earnings 7,359,361 (1,159,206) 7,264,917 (1,144,330)
Capital adjustments (189,262) 233,699 (186,833) 230,700
Minority interests 3,357,715 - 3,314,625 -
Total shareholders’ equity 17,177,550 1,024,567 16,957,108 1,011,418
Total liabilities and shareholders’ equity ₩46,683,437 ₩12,825,273 $46,084,341 $12,660,684
Korean Won
(in millions)
Translation into
U.S. Dollars (Note 2)
(In thousands)