Hyundai 2005 Annual Report Download - page 52
Download and view the complete annual report
Please find page 52 of the 2005 Hyundai annual report below. You can navigate through the pages in the report by either clicking on the pages listed below, or by using the keyword search tool below to find specific information within the annual report.-
 1
1 -
2
-
3
-
4
-
5
-
6
-
7
-
8
-
9
-
10
-
11
-
12
-
13
-
14
-
15
-
16
-
17
-
18
-
19
-
20
-
21
-
22
-
23
-
24
-
25
-
26
-
27
-
28
-
29
-
30
-
31
-
32
-
33
-
34
-
35
-
36
-
37
-
38
-
39
-
40
-
41
-
 42
42 -
 43
43 -
 44
44 -
 45
45 -
 46
46 -
 47
47 -
 48
48 -
 49
49 -
 50
50 -
 51
51 -
 52
52 -
 53
53 -
 54
54 -
 55
55 -
 56
56 -
 57
57 -
 58
58 -
 59
59 -
 60
60 -
 61
61 -
 62
62 -
63
 |
 |

102
HYUNDAI MOTOR COMPANY AND SUBSIDIARIES
NOTES TO CONSOLIDATED FINANCIAL STATEMENTS FOR THE YEARS ENDED DECEMBER 31, 2005 AND 2004
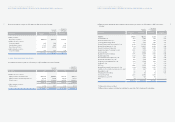
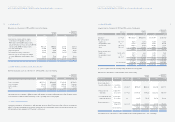
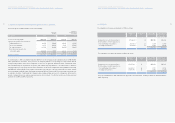
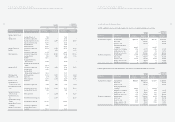
20. DIVIDENDS:
The computation of the proposed dividends for 2005 is as follows:
Number of Dividend rate Korean Won
Translation into
shares (%) (In millions)
U.S. Dollars(Note 2)
(In thousands)
Common shares, net of treasury shares 207,642,232 25 ₩259,553 $256,222
Preferred shares, net of treasury shares:
First and Third preferred shares 25,637,321 26 33,328 32,900
Second preferred shares 36,613,865 27 49,429 48,795
₩342,310 $337,917
The computation of the proposed dividends for 2004 is as follows:
Number of Dividend rate Korean Won
Translation into
shares (%) (In millions)
U.S. Dollars(Note 2)
(In thousands)
Common shares, net of treasury shares 217,807,392 23 ₩250,479 $247,265
Preferred shares, net of treasury shares:
First and Third preferred shares 24,492,541 24 29,391 29,014
Second preferred shares 37,571,005 25 46,963 46,360
₩326,833 $322,639
The proposed dividends for 2005 and 2004 were approved at the shareholders’ meeting on March 10, 2006 and March 4,
2005, respectively.
101
HYUNDAI MOTOR COMPANY AND SUBSIDIARIES
NOTES TO CONSOLIDATED FINANCIAL STATEMENTS FOR THE YEARS ENDED DECEMBER 31, 2005 AND 2004
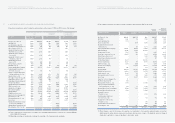
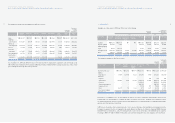
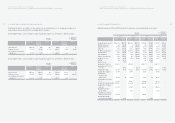
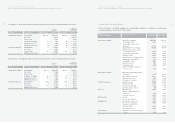
19. INCOME TAX EXPENSE AND DEFERRED INCOME TAX ASSETS (LIABILITIES):
Income tax expense in 2005 and 2004 consists of the following:
As of December 31, 2005, accumulated temporary differences of the Company and its subsidiaries amount to ₩4,506,564
million (US$4,448,731 thousand). Some portion of the temporary difference, net operating loss carry-forwards and tax
exemption carry-forwards, which are more likely than not, were not recognized as deferred tax assets. Deferred tax assets
were calculated using the expected tax rate (27.5%) with residual temporary differences. As of December 31, 2005, the
Company believes the total current and non-current deferred income tax assets of ₩462,203 million (US$456,271 thousand)
and ₩452,915 million (US$447,103 thousand), respectively, before deduction of the total current and non-current deferred
income tax liabilities of ₩6,451 million (US$ 6,368 thousand) and ₩173,677 million (US$171,448 thousand), respectively, can
be realized in the future. Additionally, the Company believes average ordinary income in the coming years will exceed the
amount of deferred taxes to be realized every year based on its assessment. The effective tax rates are 16.83 percent and
33.87 percent in 2005 and 2004, respectively.
Korean Won
(In millions)
Translation into
U.S. Dollars (Note 2)
(In thousands)
Description 2005 2004 2005 2004
Income tax currently payable ₩482,488 ₩846,929 $476,296 $836,060
Changes in deferred income taxes due to:
Temporary differences 360,870 222,404 356,239 219,550
Tax loss carried forward 42,376 (88,794) 41,832 (87,654)
Tax credit carried over (69,765) (49,644) (68,870) (49,007)
Deferred income taxes directly
reflected to equity (245,512) (9,571) 242,361 9,449
87,969 74,395 86,840 73,440
Income tax expense ₩570,457 ₩921,324 $563,136 $909,500