Hyundai 2005 Annual Report Download - page 51
Download and view the complete annual report
Please find page 51 of the 2005 Hyundai annual report below. You can navigate through the pages in the report by either clicking on the pages listed below, or by using the keyword search tool below to find specific information within the annual report.-
 1
1 -
2
-
3
-
4
-
5
-
6
-
7
-
8
-
9
-
10
-
11
-
12
-
13
-
14
-
15
-
16
-
17
-
18
-
19
-
20
-
21
-
22
-
23
-
24
-
25
-
26
-
27
-
28
-
29
-
30
-
31
-
32
-
33
-
34
-
35
-
36
-
37
-
38
-
39
-
40
-
 41
41 -
 42
42 -
 43
43 -
 44
44 -
 45
45 -
 46
46 -
 47
47 -
 48
48 -
 49
49 -
 50
50 -
 51
51 -
 52
52 -
 53
53 -
 54
54 -
 55
55 -
 56
56 -
 57
57 -
 58
58 -
 59
59 -
 60
60 -
 61
61 -
62
-
63
 |
 |

100
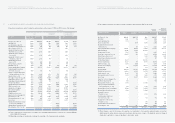
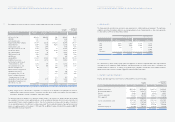
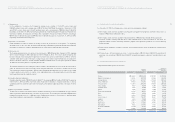
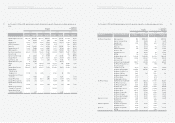
18. SELLING AND ADMINISTRATIVE EXPENSES:
Selling and administrative expenses are as follows:
Korean Won
(In millions)
Translation into
U.S. Dollars (Note 2)
(In thousands)
2005 2004 2005 2004
Salaries ₩1,984,507 ₩1,925,695 $1,959,039 $1,900,982
Export related expenses 1,356,056 1,238,938 1,338,654 1,223,038
Sales promotion 2,811,283 1,903,907 2,775,205 1,879,474
Sales commission 574,628 531,333 567,254 524,514
Sales warranties 1,122,815 2,084,101 1,108,406 2,057,355
Taxes and dues 84,947 59,088 83,857 58,330
Communications 47,753 78,058 47,140 77,056
Utilities 47,150 47,866 46,545 47,252
Freight and warehousing 223,047 202,529 220,185 199,930
Rent 105,959 65,630 104,599 64,788
Travel 132,563 125,297 130,862 123,689
Service charges 255,692 784,157 252,411 774,094
Supplies 96,404 99,045 95,167 97,774
Research 620,621 628,237 612,656 620,175
Depreciation 222,823 213,053 219,963 210,319
Amortization 70,546 217,691 69,641 214,897
Provision for bad debt 612,588 933,732 604,727 921,749
Other 216,852 160,685 214,068 158,623
₩10,586,234 ₩11,299,042 $10,450,379 $11,154,039
HYUNDAI MOTOR COMPANY AND SUBSIDIARIES
NOTES TO CONSOLIDATED FINANCIAL STATEMENTS FOR THE YEARS ENDED DECEMBER 31, 2005 AND 2004
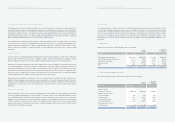
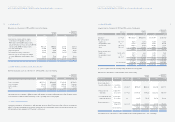
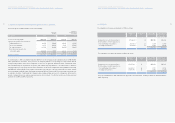
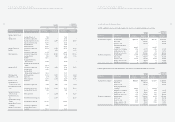
17. PLEDGED ASSETS, CHECKS AND NOTES:
As of December 31, 2005, the following assets, checks and notes are pledged as collateral:
(1) The Company’s and its domestic subsidiaries’ property, plant and equipment are pledged as collateral for various loans to a
maximum of ₩2,972 billion (US$ 2,934 million).
(2) The Company’s and its domestic subsidiaries’ financial instruments of ₩95,682 million (US$ 94,454 thousand),some
investment securities, including 1,593,466 shares of KIA, 4,400,000 shares of Eukor Car Carriers Inc. and others, are
pledged as collateral for various borrowings, debentures, payables, lease agreements, guarantees of a customer financing
system and others.
(3) Certain overseas subsidiaries’ receivables, inventories and other financial business assets are pledged as collateral for their
borrowings.
(4) 50 blank checks, 162 blank promissory notes, 1 check amounting to ₩2,624 million (US$2,590 thousand) and 6
promissory notes amounting to ₩6,328 million (US$6,247 thousand) are pledged as collateral to financial institutions and
others.
99
HYUNDAI MOTOR COMPANY AND SUBSIDIARIES
NOTES TO CONSOLIDATED FINANCIAL STATEMENTS FOR THE YEARS ENDED DECEMBER 31, 2005 AND 2004
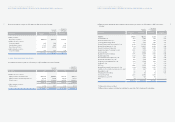
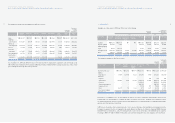
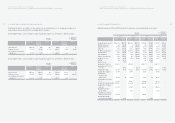
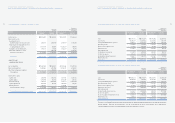
(1) Treasury stock
For the stabilization of stock price, the Company has treasury stock consisting of 11,416,470 common shares and
2,950,960 preferred shares with a carrying value of ₩736,113 million (US$726,666 thousand) as of December 31, 2005
and 820,910 common shares and 3,138,600 preferred shares with a carrying value of ₩90,348 million (US$89,189
thousand) as of December 31, 2004, respectively, acquired directly or indirectly through the Treasury Stock Fund and Trust
Cash Fund. In addition, the Company’s ownership portion of subsidiaries’ treasury stock held by themselves, amounting to
₩7,579 million (US$7,482 thousand) and ₩7,993 million (US$7,890 thousand) as of December 31, 2005 and 2004,
respectively, are included in the treasury stock.
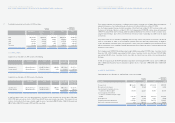
(2) Discounts on stock issuance
Certain subsidiaries accounted for expense on issuance of new stock as discounts on stock issuance. The Company’s
ownership portion of these discounts amounting to ₩1,688 million (US$1,666 thousand) and ₩3,244 million (US$3,202
thousand) is accounted for as a debit to capital adjustments as of December 31, 2005 and 2004, respectively.
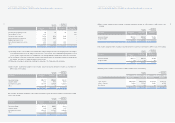
(3) Stock option cost
The Company granted directors stock options at an exercise price of ₩26,800 (grant date: February 14, 2003, beginning
date for exercise: February 14, 2006, expiry date for exercise: February 13, 2011). These stock options all require at least
two-year continued service starting from the grant date. If all of the stock options as of December 31, 2005 are exercised,
1,242,554 shares will be issued as new shares or using treasury stock or will be compensated by cash, according to the
decision of the Board of Directors. In 2005 and 2004, 430,400 and 429,800 shares of stock options granted as of March
10, 2000 were exercised by directors, respectively (See Note 15).
The Company calculates the total compensation expense using the option-pricing model. In the model, the risk-free rate of
4.94%, an expected exercise period of 5.5 years and an expected variation rate of stock price of 63.29 percent are used.
Total compensation expenses amounting to ₩14,231 million (US$14,048 thousand) have been accounted for as a charge
to current operations and a credit to stock option cost in capital adjustments over the required period of service (two years)
from the grant date using the straight-line method.
(4) Cumulative translation adjustments
Cumulative translation debits of ₩292,525 million (US$288,771 thousand) and ₩213,608 million (US$210,867 thousand) as
of December 31, 2005 and 2004, respectively, which result from the translation of financial statements of overseas
subsidiaries and the two branches located in the United States, are included in capital adjustments on the basis set forth in
Note 2.
(5) Gain (loss) on valuation of derivatives
The gain (loss) on valuation of the effective portion of derivative instruments for cash flow hedging purpose from forecasted
exports is included in capital adjustments on the basis set forth in Note 2. The Company recorded a gain of ₩9,000 million
(US$8,885 thousand) and a loss of ₩28,463 million (US$28,098 thousand) as of December 31, 2005 and 2004,
respectively, including its ownership portion of subsidiaries’ gain and loss.